Fig. 7.
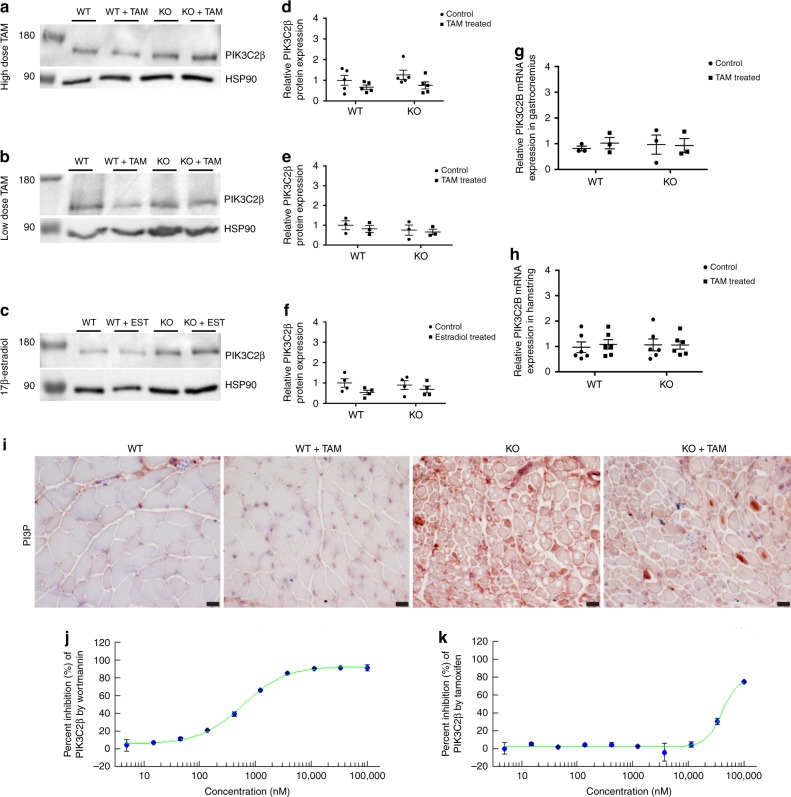
Tamoxifen treatment does not affect the levels or activity of PIK3C2B. a Representative western blot for PIK3C2B, with HSP90 loading control, in Mtm1 KO mice treated with high-dose tamoxifen (TAM), b low-dose TAM, and c 17β-estradiol; position of the molecular weight markers indicated (in kDa). Samples for each drug trial derive from the same experiment, and blots were processed in parallel for each drug trial. d–f PIK3C2B levels were determined by densitometry, standardized to HSP90 and are represented as the fold difference from the average of the WT (n = 5 mice per group for high-dose TAM, n = 3 for low-dose TAM, n = 4 for 17β-estradiol); graphs represent, 5, 3, and 4 technical replicates respectively and mean ± SEM). g, h Graphs depicting mRNA levels of PIK3C2B in g gastrocnemius and h hamstring of WT and Mtm1 KO mice ± tamoxifen (TAM) treatment. mRNA expression was determined by real-time qPCR and analyzed by the 2−ΔΔCT method. Values were normalized to actin and represent the fold difference from the average of the WT (n = 3 mice per group for gastrocnemius; n = 6 mice per group for hamstring, graphs represent three technical and biological replicates for gastrocnemius; three technical and biological replicates for hamstring and ±SEM). Statistical analyses for a–h were conducted by two-way ANOVA followed by Tukey’s multiple comparisons post-test. No significant differences were observed. i Immunohistochemistry against PI3P in WT and Mtm1 KO mice, and TAM treated WT and Mtm1 KO mice show no overall difference in PI3P levels following treatment with high-dose TAM. j, k Graphs of PIK3C2B in vitro kinase assay depicting the percent inhibition of PIK3C2B by wortmannin (control; IC50 = 500 nM) and tamoxifen (IC50 = 40 µM). Scale bars = 20 µm

