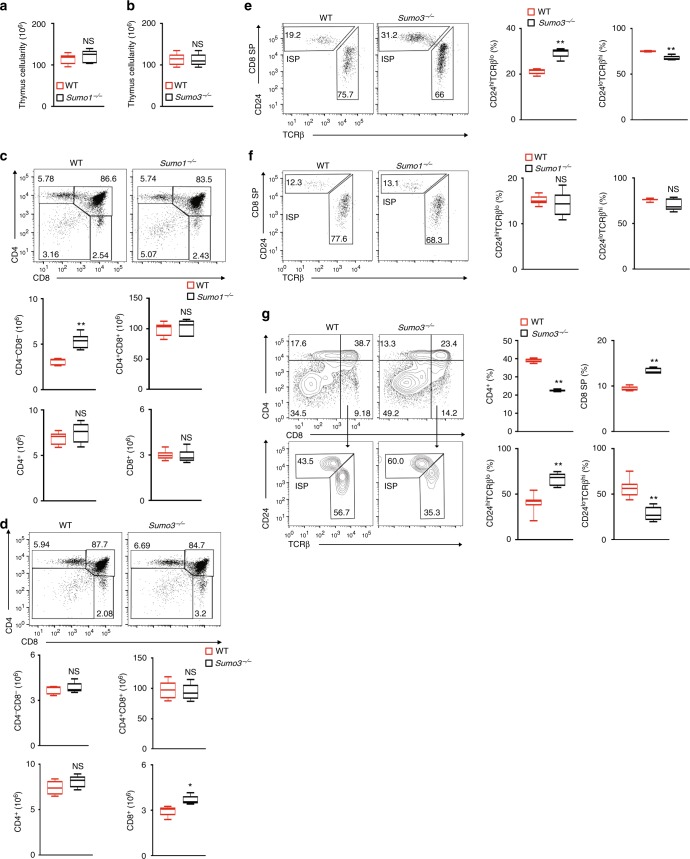
Fig. 2.
SUMO3, but not SUMO1, is required for the progression of thymic ISPs. a, b Thymic cellularity of WT and a Sumo1−/−or b Sumo3−/− mice (n = 5 per genotype). c, d Representative flow cytometric analysis of CD4 and CD8 on the surface of thymocytes from WT and c Sumo1−/− or d Sumo3−/− mice (top two panels). The bottom panels present the absolute numbers of CD4+, CD8+, CD4−CD8−, and CD4+CD8+ thymocytes for individual mice (n = 5 per genotype). e, f Representative flow cytometric analysis of CD24 and TCRβ expression in CD8+ cells of WT and e Sumo3−/− or f Sumo1−/− thymi (two panels on the left). The two panels on right present the percentages of immature TCRloCD24hi ISPs and mature TCRhiCD24lo cells in the thymi of individual mice (n = 5 per genotype). g Representative flow cytometric analysis of CD4 and CD8 expression in cells differentiated from sorted WT and Sumo3−/− CD4-CD8−thymocytes co-cultured for 3 d with OP9-DL4 stroma cells and IL-7 (5 ng/ml) to assess ex vivo thymocyte development (top two panels on the left). The top two panels on the right present the percentages of CD4+ and CD8+ cells differentiated from individual mice (n = 5 per genotype). The bottom two panels on the left show flow cytometric analysis of CD24 and TCRβ expression in CD8+ cells from the top panels. The bottom two panels on the right present the percentages of immature TCRloCD24hi ISPs and mature TCRhiCD24lo thymocytes from individual mice (n = 5 per genotype). NS, not significant (P > 0.05); *P < 0.05 (t-test); **P < 0.01 (t-test). Data are from three experiments (a, b; c, d, four bottom panels; e–g, two right panels; presented as median [central line], maximum and minimum [box ends], and outliers [extended lines]) or are from one representative of three independent experiments (c, d, top two panels; e–g, two panels on left)

