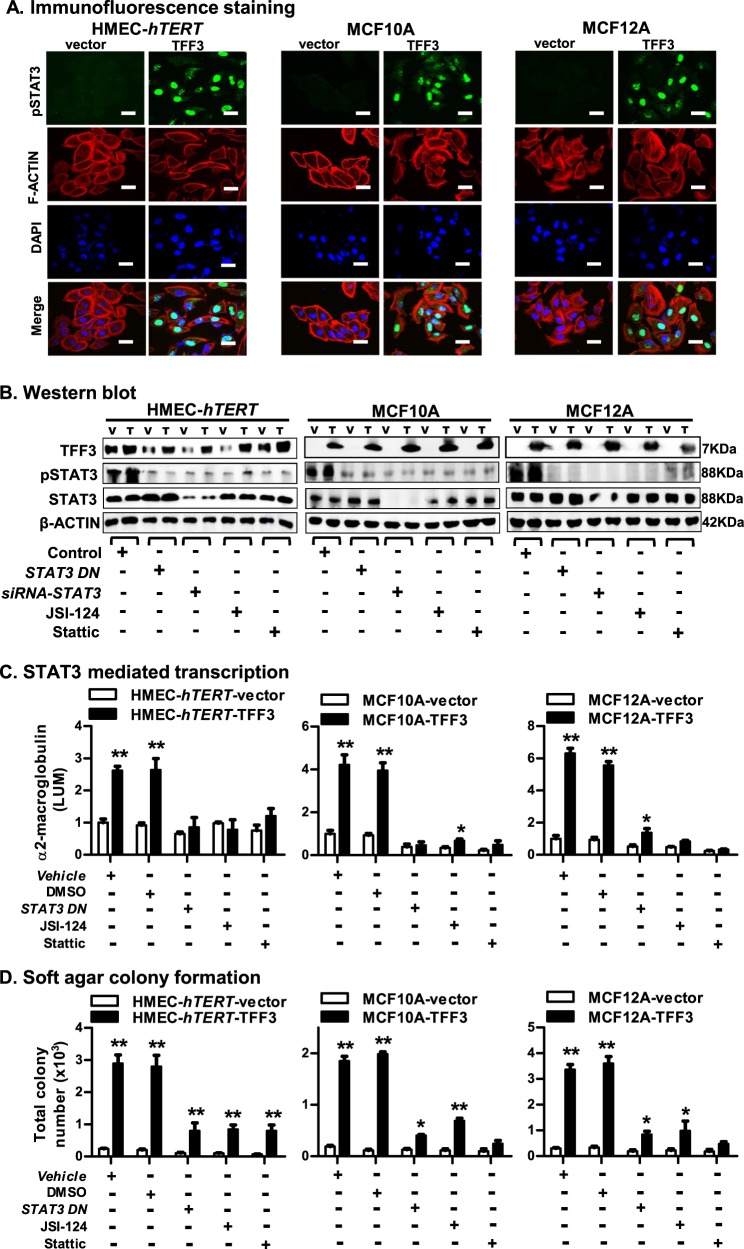
Fig. 3. TFF3 mediates its oncogenic activities in immortalized-HMECs through STAT3 activity.
a Confocal microscopic scanning of pSTAT3 and F-actin arrangement in immortalized-HMECs with forced expression of TFF3 and their vector control cells. Green colour denoted pSTAT3, red colour denoted F-actin, and blue colour denoted nuclei stained with DAPI. Representative images were captured under oil immersion ×600 magnification. b Western blot analysis was used to assess the protein levels of TFF3, pSTAT3 (at Tyr 705), and STAT3 in immortalized-HMECs with forced expression of TFF3 and their vector control cells, after inhibition of STAT3. Inhibition of STAT3 executed using transient-transfection of siRNA-STAT3 or STAT3-dominant negative (DN); or on exposure to JSI-124 (0.2 µM) or Stattic (2 µM) inhibitor. Densitometric analysis demonstrated that the levels of pSTAT3 (Tyr 705) increased 39 ± 4% in HMEC-hTERT-TFF3, 25 ± 6% in MCF10A-TFF3, and 20 ± 3% in MCF12A-TFF3 cells compared to their vector control cells. Soluble whole cellular extracts were run on an SDS-PAGE and immunoblotted as described in materials and methods. β-actin was used as an input control for cell lysate. The sizes of detected protein bands in kDa are shown on the right side. c STAT3-mediated transcription was examined using luciferase activity of α2-M promoter activity in immortalized-HMECs with forced expression of TFF3 and their vector control cells after transient-transfection of STAT3 DN or on exposure to JSI-124 (0.2 µM) or Stattic (2 µM) inhibitor. d Soft agar colony formation by immortalized-HMECs with forced expression of TFF3 and their vector control cells after transient-transfection of STAT3 DN or on exposure to JSI-124 (0.2 µM) or Stattic (2 µM) inhibitor. The luciferase assay and soft agar colony formation assay was performed as described in material and methods. The column is mean of triplicate experiments; bars, ±SD. **P < 0.001, *P < 0.05

