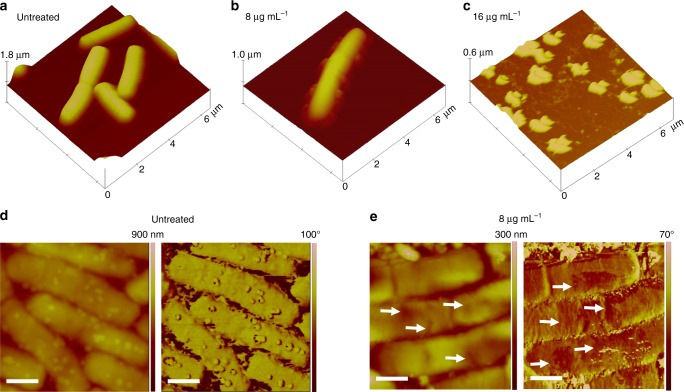
Fig. 2.
TappingTM mode AFM imaging of B. cereus deposited on mica surface. a, d Depictions of B. cereus before the exposure of compound 1, whereas b, c, and e show the bacteria in the presence of compound 1. a–c 3D representations of topographic images, whereas d and e (scale bars = 750 nm) are detailed topographic (left panels) and phase-contrast (right panels) images of untreated cells and upon interaction with glycoside 1 (8 μg mL−1), respectively. The arrows indicate lesions in the cellular envelope

