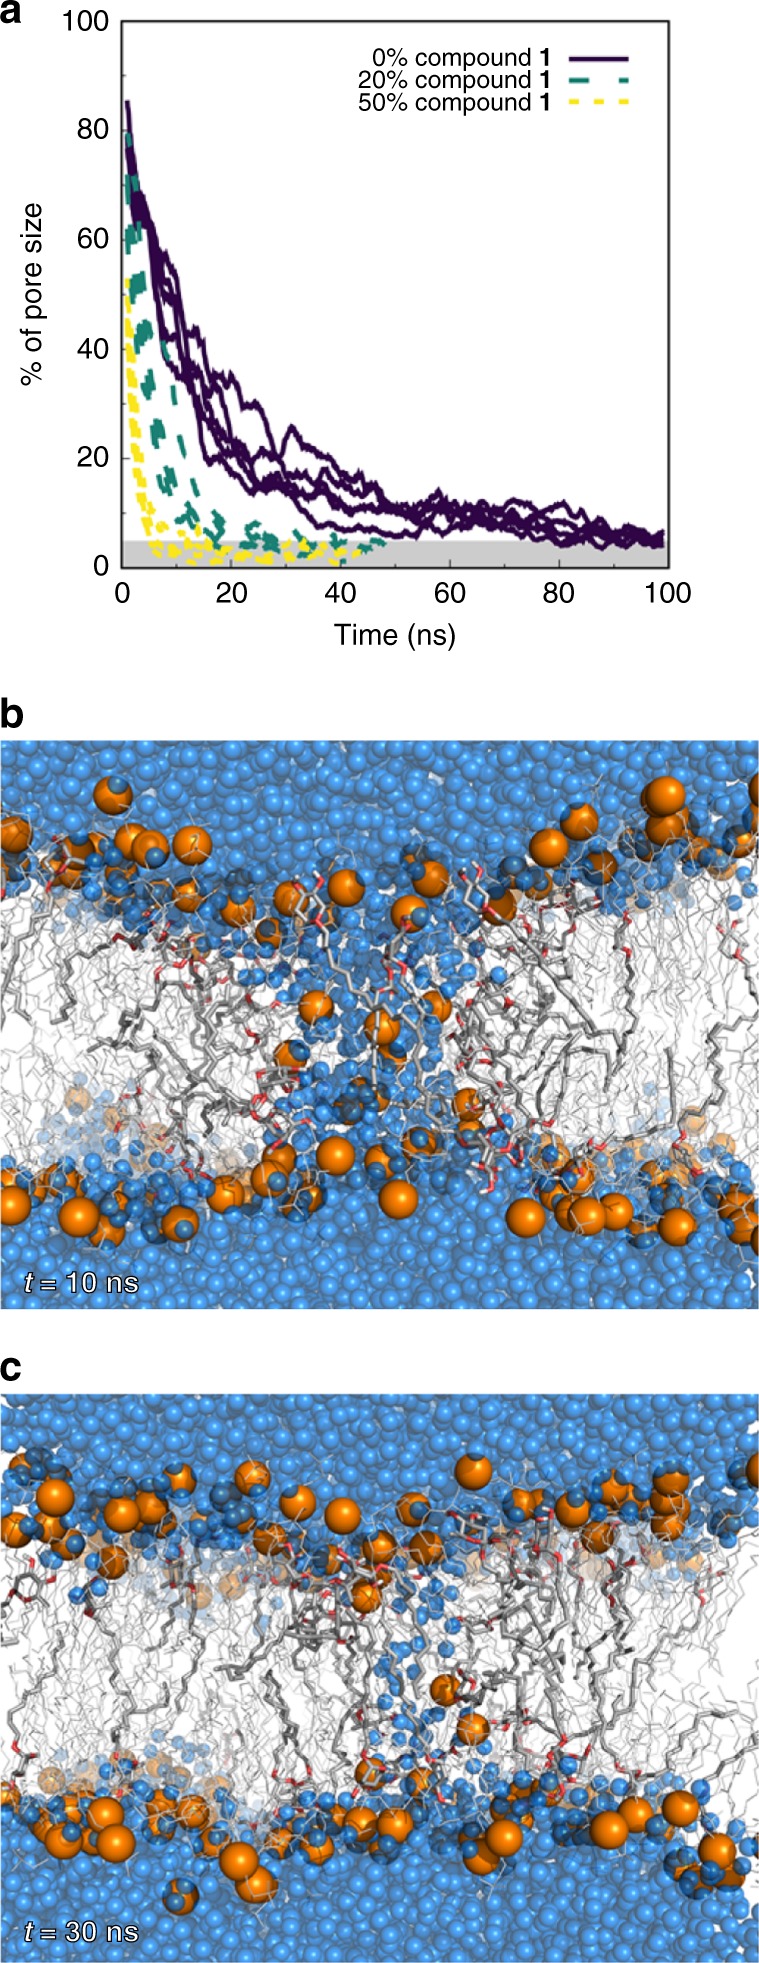
Fig. 4.

Effect of compound 1 on the stability of pre-formed membrane pores. a Estimated size of pre-formed membrane pores over time without external surface tension. The five replicates of each system, namely pure DMPC (control) and mixtures containing ~ 20% or 50% of compound 1 are presented. A full pore corresponds to a region with ~ 1800 water molecules between leaflets. The gray region represents very small pore sizes and, in many cases, complete closure of the pore. Pore size was estimated using the number of water molecules in the interior of the transmembrane cavity. The data are shown as a floating window average (2 ns) for clarity. A graphical representation of b a large pore and c a small pore is also shown for a 20% molar ratio mixture. DMPC molecules are shown as thin lines while those of compound 1 are shown as thicker sticks. Water molecules and phosphorus atoms are shown as blue and orange spheres, respectively
