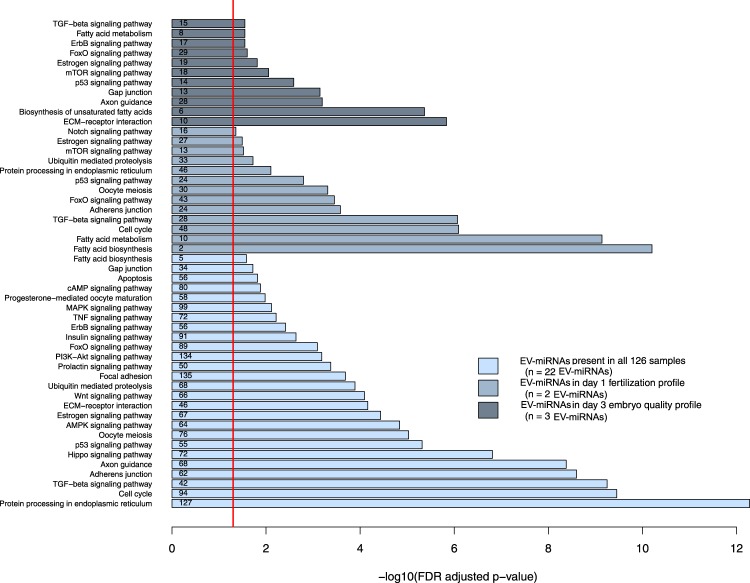
Figure 2.
Pathways analyses – Functional pathways of EV-miRNAs using DIANA Tools miRPath-v3.0. Light blue bars represent pathways enriched among extracellular-packaged miRNAs (EV-miRNAs) detected in all follicular fluid samples, blue bars represent those pathways enriched among EV-miRNAs that were significant in the fertilization status analyses, and the dark blue bars represent pathways enriched among EV-miRNAs that were significant in the day three embryo quality analyses. The red line represents the statistical significant FDR threshold (FDR < 0.05) and the small numbers within each bar are the number of genes found to be associated with those EV-miRNAs.

