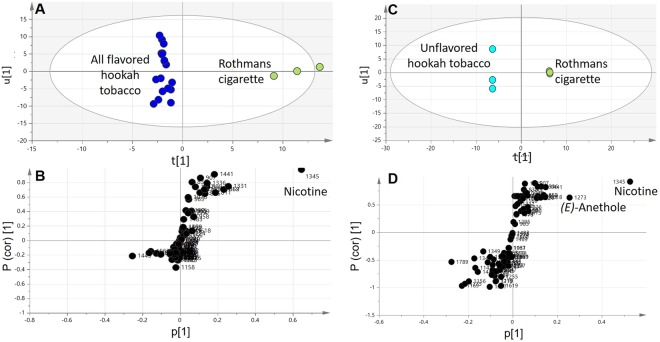
Figure 6.
OPLS-DA score plot derived from modelling cigarette aroma versus hookah flavours (A) and cigarette aroma versus unflavoured “Kas” brand (C) each modelled one at a time. The respective S-plot (B,D) shows the covariance p[1] against the correlation p(cor)[1] of the variables of the discriminating component of the OPLS-DA model. Cut-off values of P < 0.05 were used; selected variables are highlighted in the S-plot with kovats index value and identifications are discussed in text.

