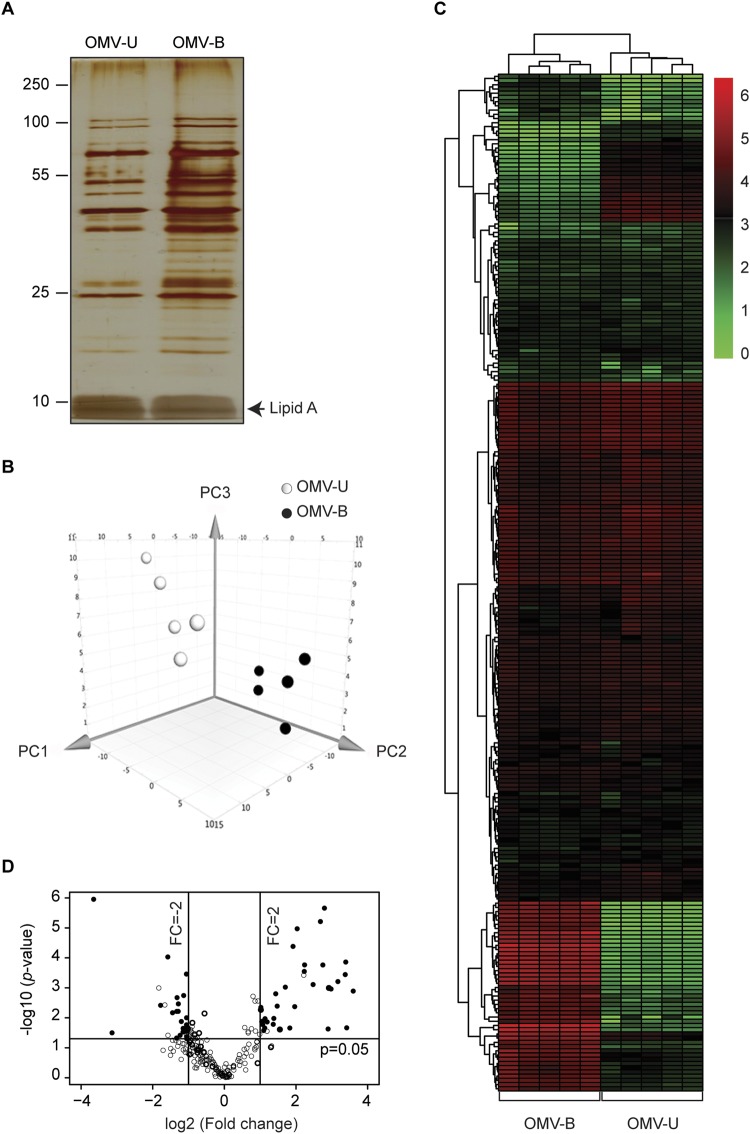
Figure 2.
C. jejuni alters protein content of OMVs upon exposure to low concentration of bile. (A) Protein profiles of OMVs isolated from untreated (OMV-U) and bile-treated (OMV-B) C. jejuni were compared by 12% SDS-PAGE followed by visualization of proteins using silver staining. Lines to the left indicate the molecular masses of the protein standards in kDa. A representative gel is shown. The gel image is adjusted for brightness and contrast by Photoshop, original gel without adjustment and with protein size marker is shown in the Supplementary Data Fig. S4A. (B) Principal component analysis showing the relative protein abundance profile of OMV samples in a 3D graph with PC1, PC2 and PC3. The data were mean centered and log transformed. The five biological samples of each type were clustered based on the variance and correlation among them. (C) Heat map of a hierarchical cluster analysis of the relative protein abundance profiles of OMV-U and OMV-B samples. The green color represents low and red color represents high expression levels. (D) Volcano plot of the complete set of shared proteins detected by proteomic analysis of OMV samples. Each point represents the difference in expression (fold-change) between OMV-U and OMV-B plotted against the level of statistical significance (p-value). Solid lines represent differential expression. Empty circles (○) represent not differentially expressed proteins, and black circles (•) represent differentially expressed proteins (p-value ≤ 0.05, fold change ≥2, and unique peptides ≥2).

