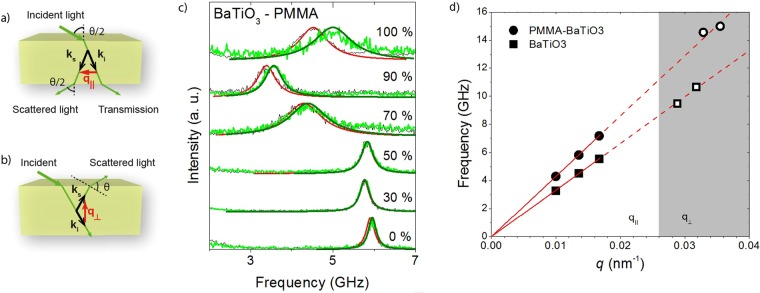
Figure 2.
Brillouin light scattering experiment. (a,b) Scattering geometries in the BLS experiment, transmission (a) and reflection (b). (c) Polarized BLS spectra (anti-Stokes side) recorded in transmission geometry at q|| = 0.0135 nm−1 before (black) and after (light green) annealing. The peak has been fitted by Lorentzian curves, red and dark green, before and after annealing, respectively. (d) In-plane and out-of-plane (grey shaded area) phonon dispersion for BaTiO3 and PMMA-BaTiO3 (50 wt%). Filled (●, ■) and empty (○, □) symbols denote measurements on 5 and 2 [µm] thick samples respectively. See supporting information for spectra acquired using 2 [µm] thick samples.

