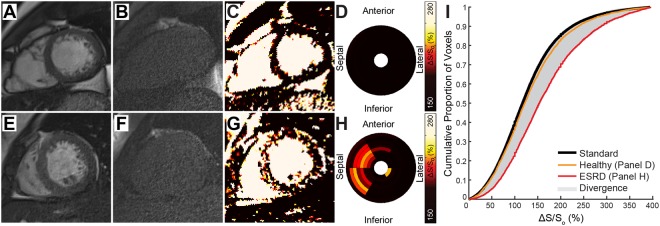
Figure 2.
MT-weighted CMR for Tissue Characterization. End diastolic cine bSSFP images acquired with a 45° excitation flip angle in a (A) representative healthy control and (E) patient with ESRD are paired with images acquired at excitation flip angle of 5° (B and F, respectively). (C,G) Maps of ΔS/So are generated as ΔS/So = (S45 − S5)/S5 * 100 (%). (C) ΔS/So maps from healthy controls demonstrate low and uniform ΔS/So values. (G) Elevations in ΔS/So observed in patients with ESRD are consistent with those seen in fibrotic tissue (see12). (D,H) Segmental average ΔS/So values from LV base (outer ring) to apex (inner ring) are represented using a bullseye plot. Compared to uniformly low ΔS/So values of a healthy control (D), ΔS/So demonstrates regional heterogeneity in a patient with ESRD, with elevated values primarily in the septum (H). (I) Using all LV myocardial ΔS/So values from the control group, a standard cumulative distribution function was generated for this study (black curve). The simulated ΔS/So distribution was dynamically resized to match the number of voxels per individual LV and compared to the distribution of ΔS/So values for that individual. Cumulative distributions from the representative healthy control (orange) and ESRD patient (red) are shown. The area between the simulated and participant’s observed distribution represents the global shift in ΔS/So values and is termed divergence. Measurement of divergence integrates the presence of diffuse elevations caused by tissue fibrosis over the entire LV.

