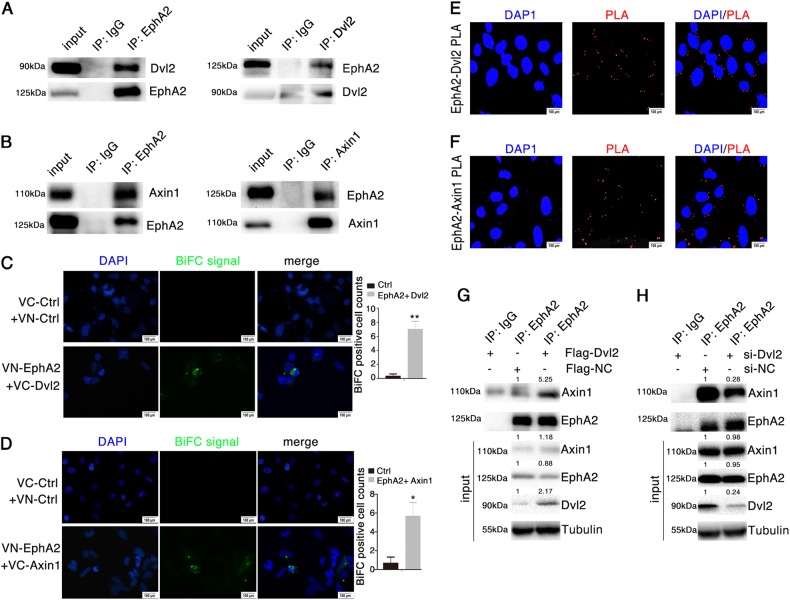
Fig. 2. EphA2 interacts with Dvl2/Axin1.
a, b Interaction between endogenous EphA2 with Dvl2 or Axin1 in AGS cells. Western blotting of cell lysates subjected to co-IP with indicated antibodies against EphA2, Dvl2 or Axin1. c, d BiFC signal analysis by fluorescence microscopy after transient co-expression of c VN-EphA2 and VC-Dvl2 and d VN-EphA2 and VC-Axin1 in HEK293 cells. e, f Proximity ligation assays (PLA) for EphA2 and Dvl2/Axin1. Interaction between endogenous EphA2 with Dvl2 (e) or Axin1 (f) in AGS cells. g, h Interaction between endogenous EphA2 and Axin1 in AGS cells transfected with Flag-Dvl2 expression vector (g) and si-Dvl2 (h) and analyzed by co-IP using anti-EphA2. Relative accumulations of proteins in different groups compared with the negative control group are indicated. Significant differences were determined with the Student’s t-test. *P < 0.05, **P < 0.01 compared with control group

