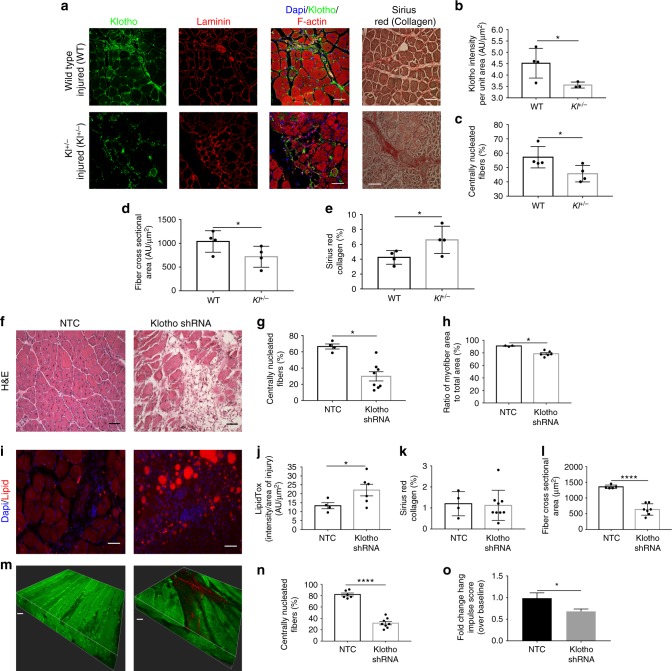
Fig. 2.
Genetic and muscle-specific loss of α-Klotho impairs skeletal muscle regeneration. a Immunofluorescence of α-Klotho, laminin, F-actin, and Sirius red stain in wild-type and Kl+/− mice 14 dpi. Scale: 50 µm. b Quantitation of α-Klotho in wild-type versus Kl+/− mice 14 dpi (n = 3–4/group; *p < 0.05, one-tailed Student’s t test). c−e Quantitation of the % of centrally nucleated fibers (n = 4/group; *p < 0.05, Mann−Whitney U test), fiber cross-sectional area (n = 4/group; *p < 0.05, one-tailed Student’s t test) and collagen (Sirius red) deposition (n = 4/group; *p < 0.05, Welchʼs t test). f Representative hematoxylin and eosin stain of non-targeting control (NTC) and shRNA to α-Klotho (0.2–3.82×10⁶ TU/TA) Scale: 50 µm. g, h Quantification of the % centrally nucleated fibers and ratio of myofiber area to total area, respectively, in NTC and Klotho shRNA-treated mice at 14 dpi (n = 3–8/group; *p < 0.05, Mann−Whitney U test). i Representative immunofluorescence imaging of lipid in NTC and α-Klotho shRNA-treated muscle at 14 dpi. Scale: 50 µm. j Quantification of lipid in NTC and Klotho shRNA-treated muscle 14 dpi (n = 4–6/group; *p < 0.05, one-tailed Student’s t test). k Quantification of collagen deposition (Sirius red) in NTC and Klotho shRNA groups (n = 4–9/group; p > 0.05, Student’s t test). l Quantification of fiber cross-sectional area of regenerating muscle fibers in NTC and α-Klotho shRNA-treated muscle (n = 5–7/group; ****p < 0.0001, one-tailed Student’s t test). m Representative second harmonic generation (SHG) images of tibialis anterior (TA) muscles injected with NTC or α-Klotho shRNA. Scale: 30 µm. n SHG quantification of the regeneration index in NTC and Klotho shRNA-treated mice at 14 dpi (n = 6–8/group; ****p < 0.0001, one-tailed Student’s t test). o Hang impulse (calculated as hanging time × mouse weight) at 14 dpi represented as a fold change from baseline score pre-injury (n = 6/group; *p < 0.05, one-tailed Student’s t test). Data represented as mean ± SEM

