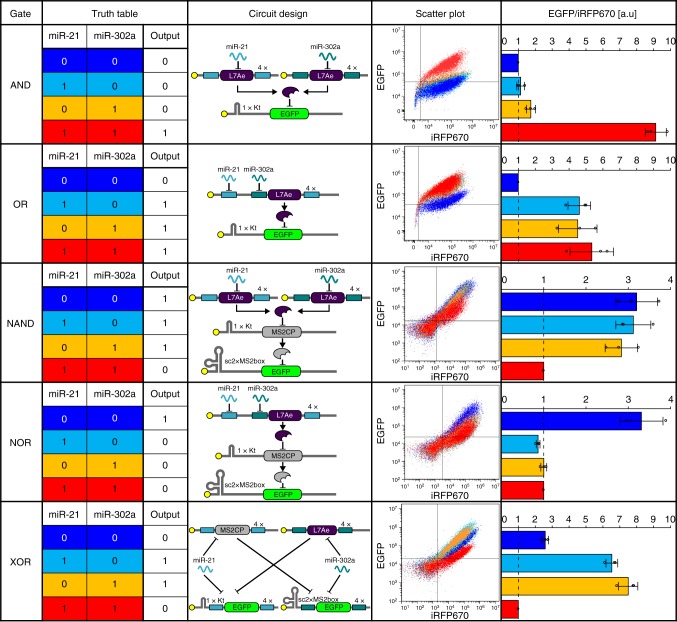
Fig. 3.
2-input miRNA-responsive logic circuits. Different colors correspond to those in the truth table, scatter plot and output level columns, respectively. MiR-21 and miR-302a mimics were used as inputs. For example, input pattern [10] colored in light blue means miR-21 present (8 nM) and miR-302a absent (0 nM). The scatter plot column shows the overlay of scatter plots for four input patterns in each circuit. The output level was calculated by dividing the mean EGFP signal by the mean iRFP670 signal. The ratio (EGFP/iRFP670) was normalized by the ratio corresponding to a representative OFF state for each circuit. Data are shown as the mean ± s.d. (n = 3). Tukey’s multiple comparisons test results are shown in Supplementary Table 1

