Fig. 3.
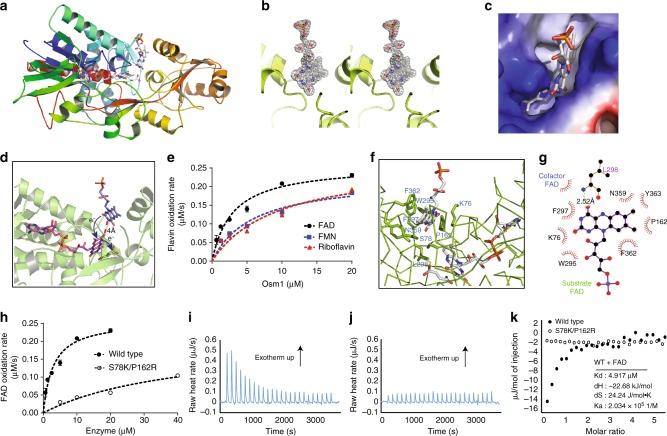
Osm1 crystal structure revealing the second FAD-binding pocket. a Ribbon diagram of the structure of a second FAD bound to Osm1. The chain from the N- to C-termini is colored blue to red. b A stereo image of an omit density map contoured at the 1−σ level around the second FAD-binding site. c Electrostatic surface in the second FAD-binding pocket. d Active site of Osm1 including a second FAD-binding site. A model of the second FAD-mediated electron transfer from the second FAD to substrate (fumarate) via the FAD cofactor (first FAD) is indicated. e All of the reduced FAD, FMN, or riboflavin (50 µM) were re-oxidized by Osm1 in the presence of fumarate. f Details of the environment of the second FAD-binding site. The residues involved in the FAD interaction are indicated. g A 2D diagram of the interaction between the second FAD and Osm1. The residues involved in the second FAD interaction are indicated. h WT Osm1 (closed circle) and S78K/P162R mutant (open circle) were incubated with reduced free FAD in the presence of fumarate. The mutant Osm1 oxidized FAD more slowly than WT Osm1. i, j Free FAD binding to WT Osm1 (i) and S78K/P162R (j) were analyzed by ITC. k The integrated heat area of WT Osm1 (closed circle) and mutant (open circle) were plotted by FAD-to-Osm1 molar ratio, calculating the binding affinity between WT Osm1 and free FAD. The experiments for calculating catalytic reaction rates were performed three times for e, h, and error bars were derived by standard deviation

