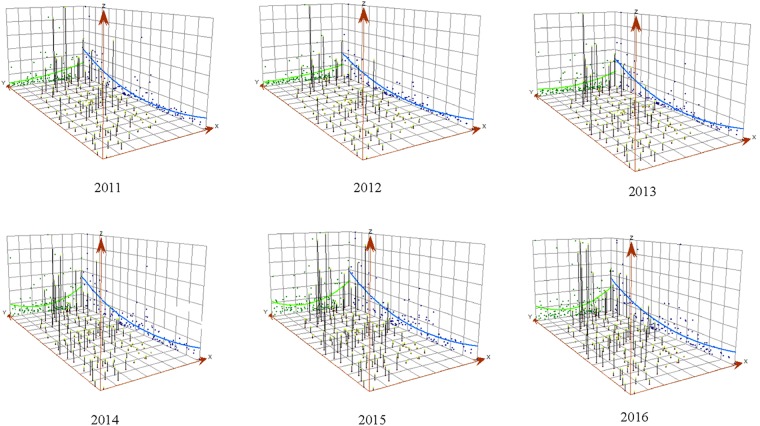
Figure 1.
Three-dimensional trend of the annual incidence rate of human brucellosis in Shanxi, China between 2011 and 2016*. X- and Y-axis represent the longitude (from west to east) and latitude (from south to north) of the geometric center of Shanxi province in China, respectively, and Z-axis represents the HB incidence, that is, one point (X, Y, Z) indicates some specific study region, and higher Z value means higher HB incidence.

