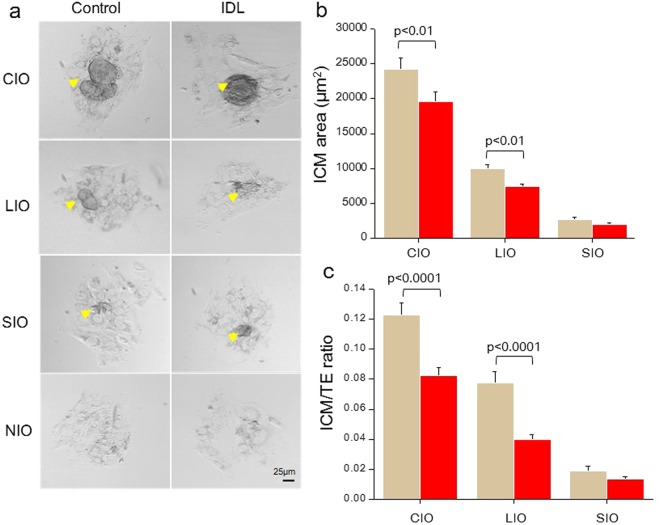
Figure 1.
(a) Representative phase contrast images of inner cell mass (ICM) outgrowths on Ex 96 in control (left panel) and IDL group (right panel). Arrow head marks ICM outgrowths (Scale bar 25 µm). (b) Quantification of ICM area on Ex 96. ICM area was significantly reduced (p < 0.01) in Completely developed ICM Outgrowth (CIO) and Large ICM Outgrowth (LIO) derived from IDL embryos in relation to corresponding control group (c) ICM to trophectoderm (TE) area ratio on Ex 96 was significantly reduced (p < 0.0001) in CIO and LIO derived from IDL embryos compared to control.

