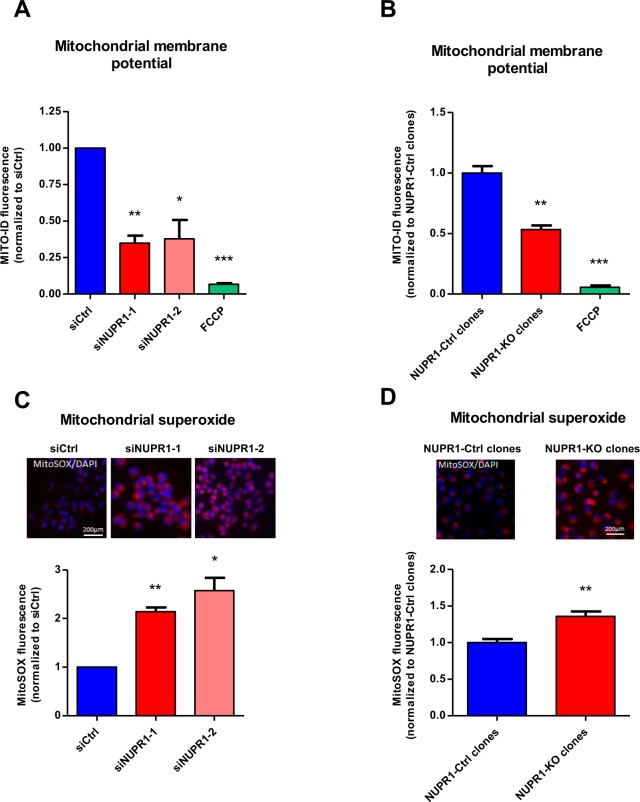
Figure 4.
Nupr1 deficiency leads to a mitochondrial membrane potential disruption inducing ROS overproduction. Flow cytometry analysis of MiaPaCa2 cells transfected with siCtrl, siNUPR1-1, or siNUPR1-2 for 72 h was carried out using MITO-ID for analysis of the mitochondrial membrane potential (A). MITO-ID was also applied to three clones of Panc-1 control cells (with wild-type NUPR1) and six clones of Nupr1 knockout cells, developed by CRISPR-Cas9 technology. Data are means of triplicates ± SEM of the 3 control and 6 knockout clones (B). ROS production was detected using MitoSOX Red by flow cytometry analysis in the experimental cell groups as described above (C,D). Representative images of the fluorescence microscopy of both ROS indicators are shown (C,D). Data are means of triplicates ± SEM. Statistically significant differences from siCtrl (*p < 0.05, **p < 0.01, ***p < 0.001) was shown.

