Figure 5.
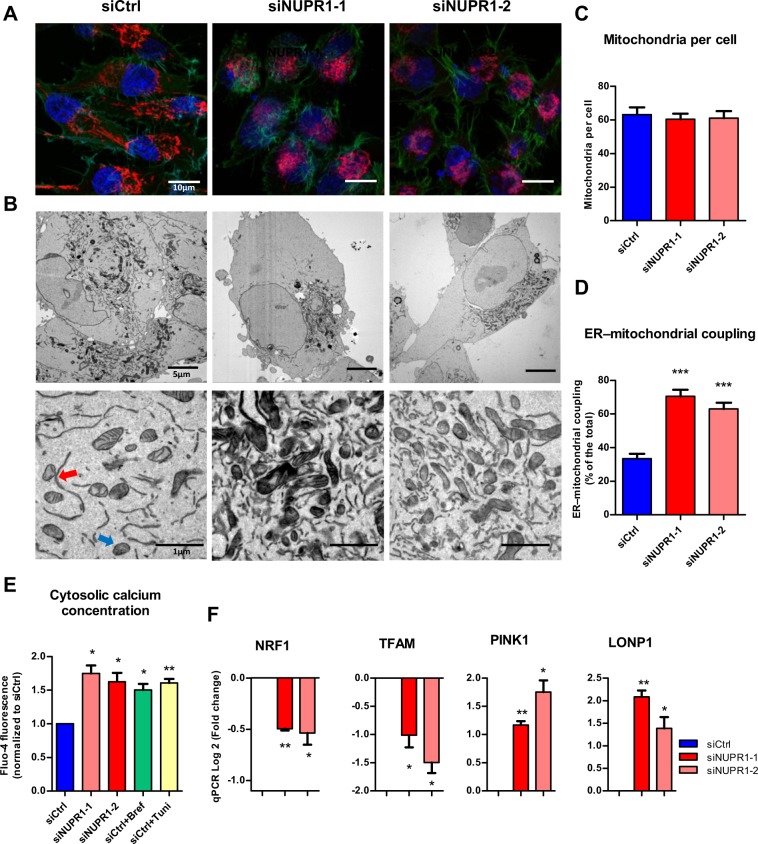
Malfunction of mitochondria in NUPR1-deficient cells. MiaPaCa2 cells transfected with siCtrl, siNUPR1-1 or siNUPR1-2 for 72 h were loaded with the mitochondrial selective probe MitoTracker Deep Red FM and, after fixation, marked with Alexa Fluor 488 Phalloidin and DAPI (A). Representative transmission electron microscopy images with different magnifications of the cells are shown. ER-mitochondrial contact or not are indicated by red or blue arrows, respectively (B). Mitochondria number per cell was evaluated counting them in transmission electron microscopy images; not less than 12 cells were counted for each condition (C). The percentage of mitochondria with ER contacts per field (mean of 10 fields) for each condition is shown; not less than 250 mitochondria were counted (D). Flow cytometry analysis was carried out using Fluo-4-AM for analysis of the cytosolic calcium concentration (E). Total RNA was extracted to monitor mRNA levels of the genes involved in the mitochondrial dynamic (F). Data are means of triplicates ± SEM. Statistically significant differences from siCtrl (*p < 0.05, **p < 0.01, ***p < 0.001) was shown.

