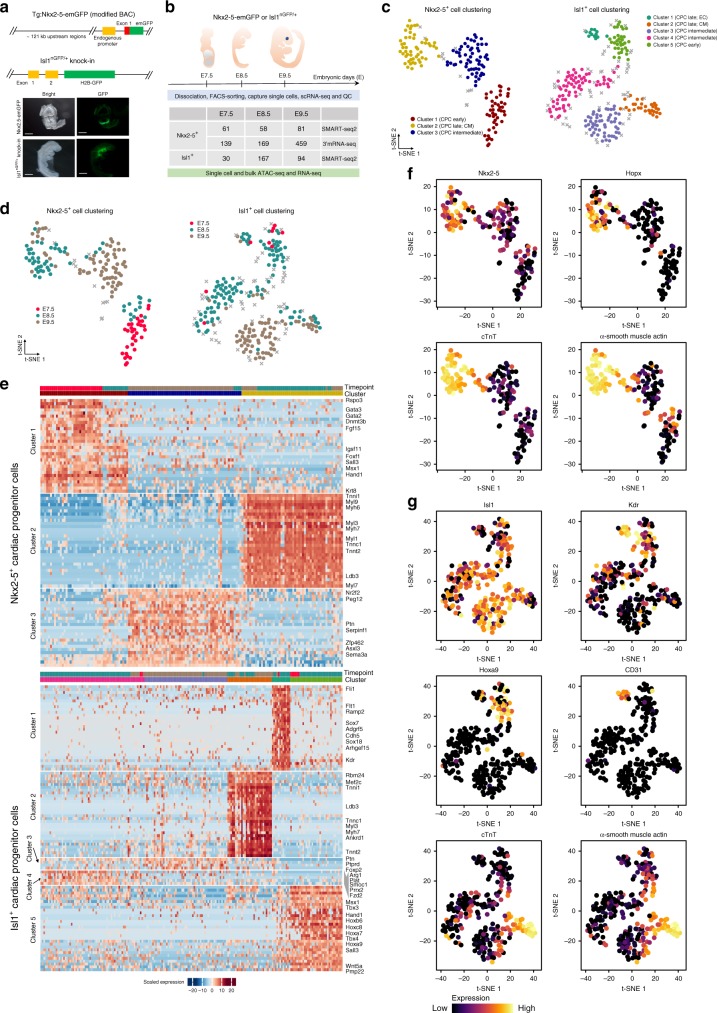
Fig. 1.
Identification of CPC subpopulations by single-cell RNA-seq. a Schematic representation of the Nkx2-5-emGFP transgenic reporter and Isl1nGFP/+ allele (top). Expression of Nkx2-5-emGFP and Isl1-nGFP at E8.5 in mouse embryonic hearts. (bottom). b Sampling time points for scRNA-seq, bulk RNA-seq, scATAC-seq, and bulk ATAC-seq. The table shows numbers of cells used for scRNA-seq. QC: quality control. c, d t-SNE visualization of individual Nkx2-5+ and Isl1+ CPCs to identify subpopulations. Colors denote corresponding clusters, and (d) development stages. Outlier cells are indicated by gray crosses. e Hierarchical clustering of expression heatmaps showing differentially expressed marker genes (AUROC > 0.8, FDR < 0.01; and lower bound of LogFC > 2 or higher bound of LogFC < −2, FDR < 0.01) across different clusters in Nkx2-5+ CPCs (top) and Isl1+ CPCs (bottom). Source data are provided in the Source Data file. f, g Expression of selected individual genes in Nkx2-5+ (f) and Isl1+ (g) CPCs. The colors represent expression levels of cells that are shown in the t-SNE plots in (c). EC, endothelial cell. CM, cardiomyocyte. Scale bar: 300 μm

