Fig. 2.
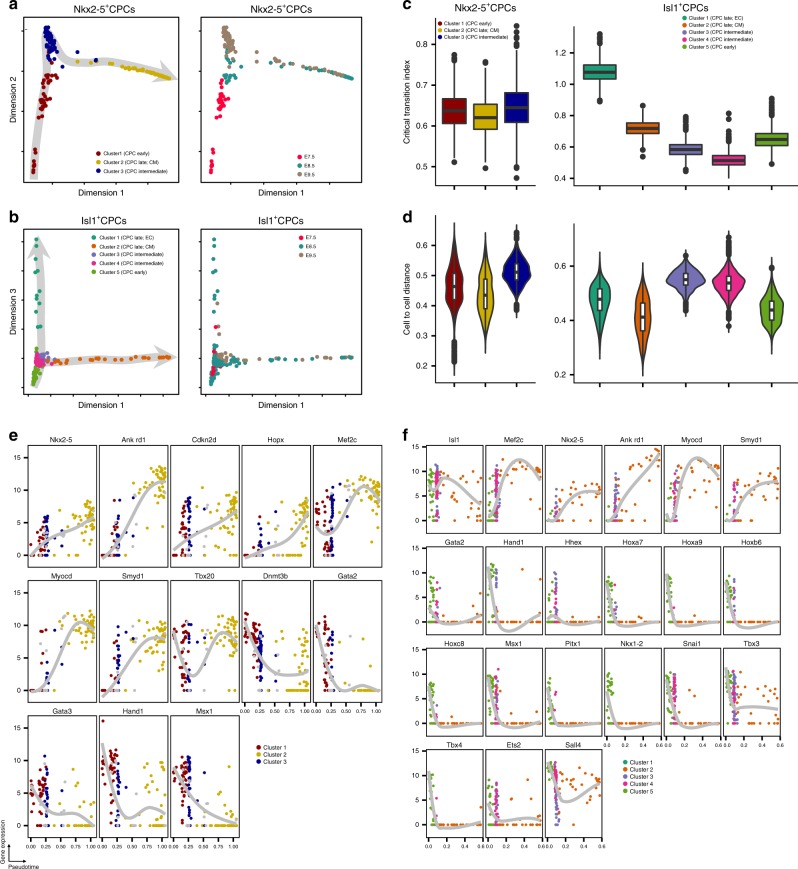
Reconstruction of trajectories and transition states of CPCs. a t-SNE plots showing diffusion pseudotimes (gray arrows) of Nkx2-5+ and b Isl1+ CPCs. Clusters and development stages of individual cells are color-coded as indicated. c Boxplots representing the distribution of IC(C) values from all marker genes for each cluster of Nkx2-5+ (left) and Isl1+ (right) cells. Lower and upper hinges correspond to the first and third quantile (25th and 75th percentile), while whiskers extend from the hinge to the smallest (largest) datum not further than 1.5 times the interquartile range. Outliers are plotted individually. d Violin plots showing the distribution of pairwise cell-to-cell distances across each cluster of Nkx2-5+ (left) and Isl1+ (right) cells. Inset boxplots show the median, lower and upper hinges as well as whiskers and outliers as in (c). e, f Expression levels of different transcription factors and key marker genes on the pseudotime axis in Nkx2-5+ (e) and Isl1+ (f) cells. Trend lines calculated by Loess regression are indicated in gray. Source data for (c–f) are provided in the Source Data file

