Fig. 3.
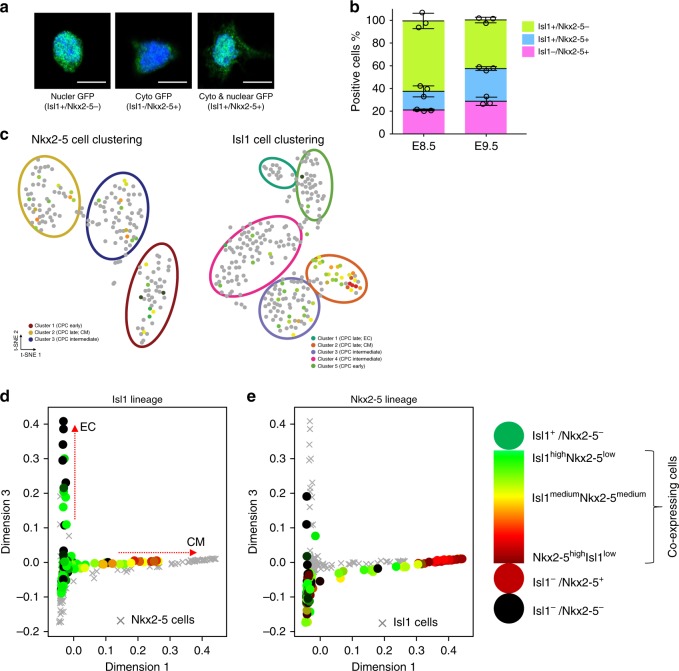
Comparison of Isl1+ and Nkx2-5+ cardiac progenitor cells. a Confocal images showing nuclear-, cytoplasmic- and co-localization of GFP in CPCs FACS-sorted from Isl1+/nGFP/Nkx2-5-emGFP+ embryos. Nuclei were stained with DAPI (blue). b Immunofluorescence-based quantification of (a). Isl1+Nkx2-5−, Isl1+Nkx2-5+ and Isl1−Nkx2-5+ cells were FACS-sorted from Isl1+/nGFP/Nkx2-5-emGFP+ embryos at E8.5 and E9.5. Quantification of different cell populations was achieved by counting all immunostained cells in a multiwell dish. Mean ± s.d. are shown. Circles represent results from different biological replicates [n = 3; Σ (cell number) of E8.5 = 225, 260, 100; Σ (cell number) of E9.5 = 175, 180, 100]. c Clustering of Isl1 and Nkx2-5 co-expressing cells in Nkx2-5+ and Isl1+ CPC subpopulations. Cells that are not double-positive are labeled in gray, and clusters are indicated by colored circles. d, e Plots showing the predicted diffusion pseudotime of Nkx2-5+ cells projected on t-SNE plots of Isl1+ cells, and the expression of Isl1+ (d) and Nkx2-5+ (e). Expression levels of Isl1 and Nkx2-5 in CPCs are represented by a color spectrum as indicated. EC, endothelial cell. CM, cardiomyocyte

