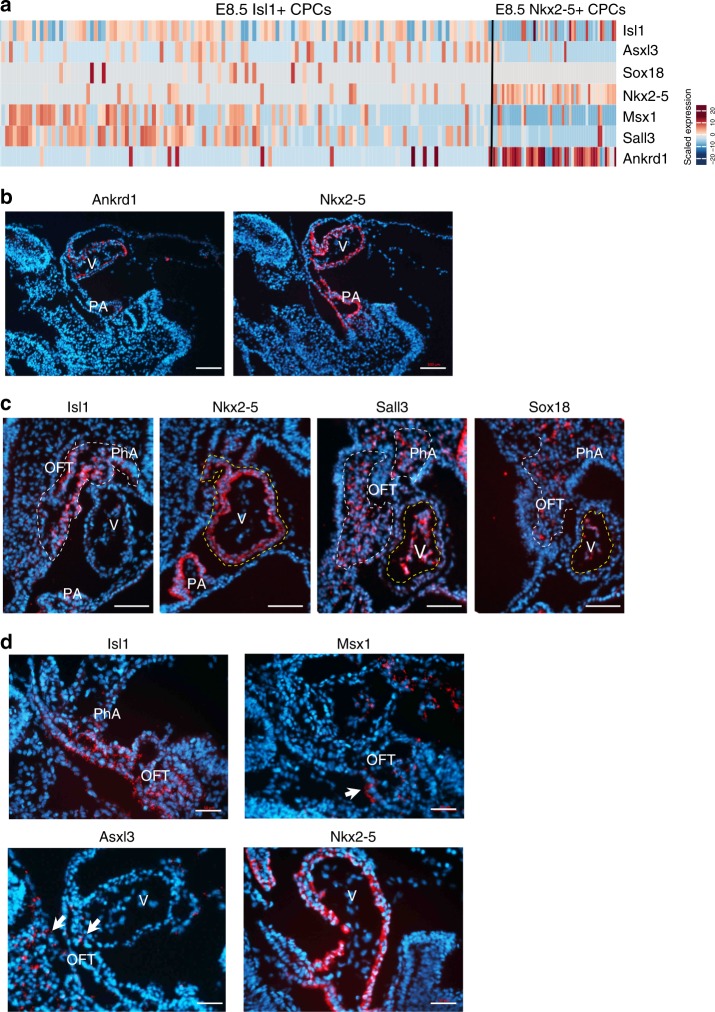
Fig. 4.
Spatial expression pattern of genes identified by scRNA-seq of CPCs. a Heatmap showing expression of selected genes in Isl1+ and Nkx2-5+ CPCs at E8.5. b–d In situ hybridization of sections from E8.5 embryos to reveal spatial expression profiles of genes identified by scRNA-seq. Scale bar: 100 μm for (b), 50 μm for (c, d). V: ventricle. PA: primitive atria. PhA: pharyngeal arches. OFT: outflow tract. Arrows indicate positive cells

