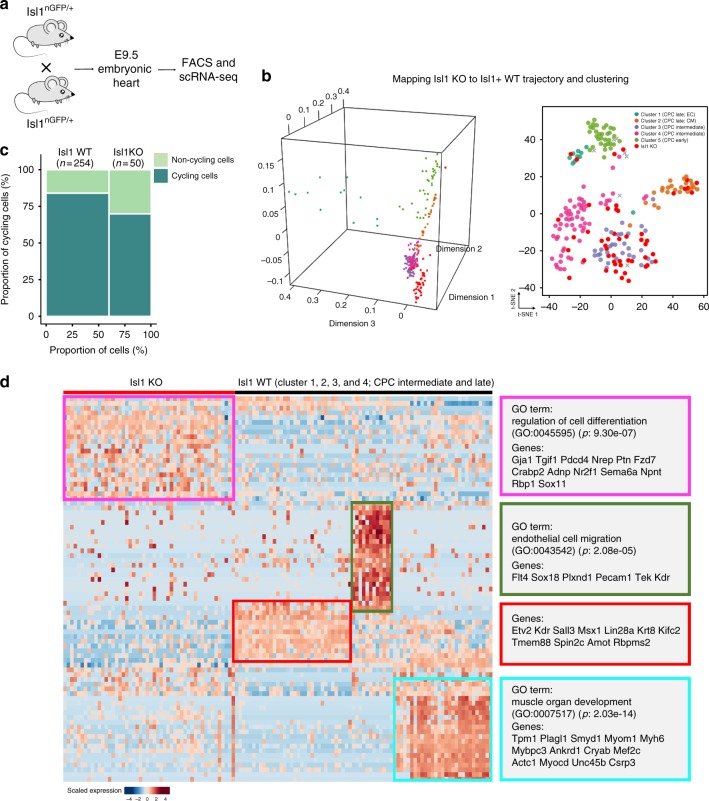
Fig. 5.
Inactivation of Isl1 prevents CPC fate bifurcation. a Schematic illustration depicting generation of Isl1 embryos and scRNA-seq. b t-SNE plots showing the predicted diffusion pseudotime of Isl1 knockout CPCs projected on Isl1+ cells (left), and clustering with Isl1+ cells (right). c Ratios of cycling and non-cycling Isl1 knockout and wild type Isl1+ CPCs. χ2 test: p = 0.062. n indicates cells numbers. d Heatmap showing expression of deregulated genes in Isl1+ cells at E8.5 and E9.5 (cluster 1, 2, and 5) isolated from Isl1 knockout and control embryos. Source data are provided in the Source Data file

