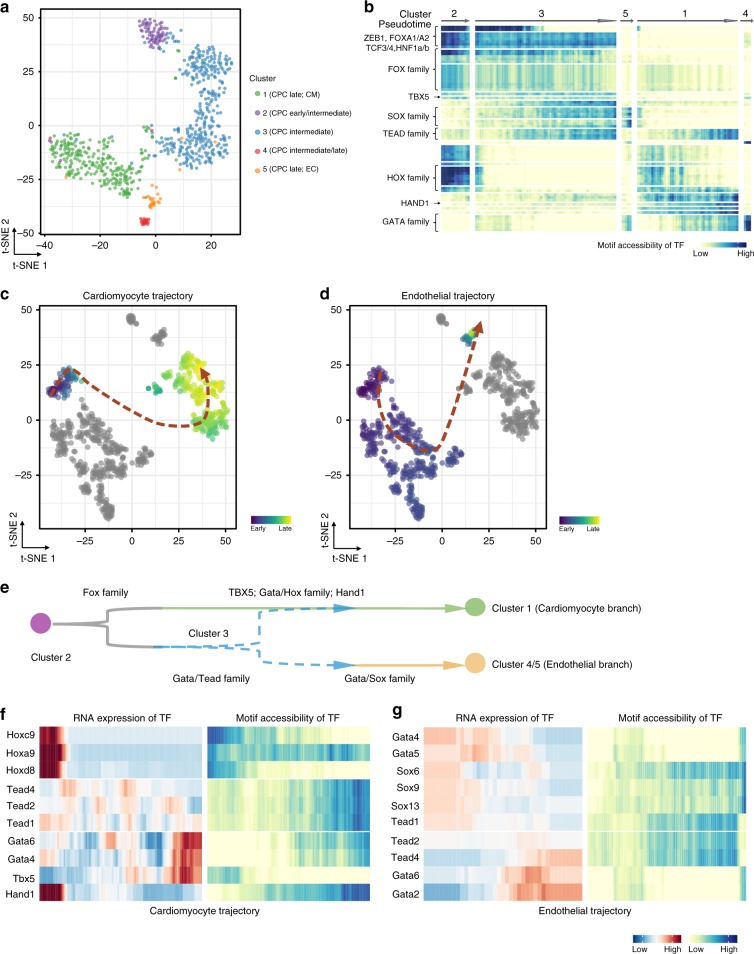
Fig. 8.
Chromatin accessibility of transcription factor binding sites. a t-SNE showing clustering of Z-scores of TF motif accessibility. Colors denote the same clusters as Fig. 7b. b Heatmap showing smoothened Z-scores of TF motif accessibility across defined clusters. Source data are provided in the Source Data file. c, d t-SNE visualization of highlighted single-cells progressing through the inferred (c) cardiomyocyte, (d) endothelial developmental trajectory (red dashed lines). Cells used for inference are colored by Z-scores of TF motif accessibility. All other cells are shown in gray. e Inferred model showing TF dynamics during Isl1+ CPC developmental bifurcation. f, g Smoothened heatmap showing dynamic RNA expression and motif accessibility of indicated TFs during cardiomyocyte (f), endothelial (d) pseudotime trajectories for gene-motif pairs (RNA:ATAC pairs). EC, endothelial cell. CM, cardiomyocyte

