Fig. 9.
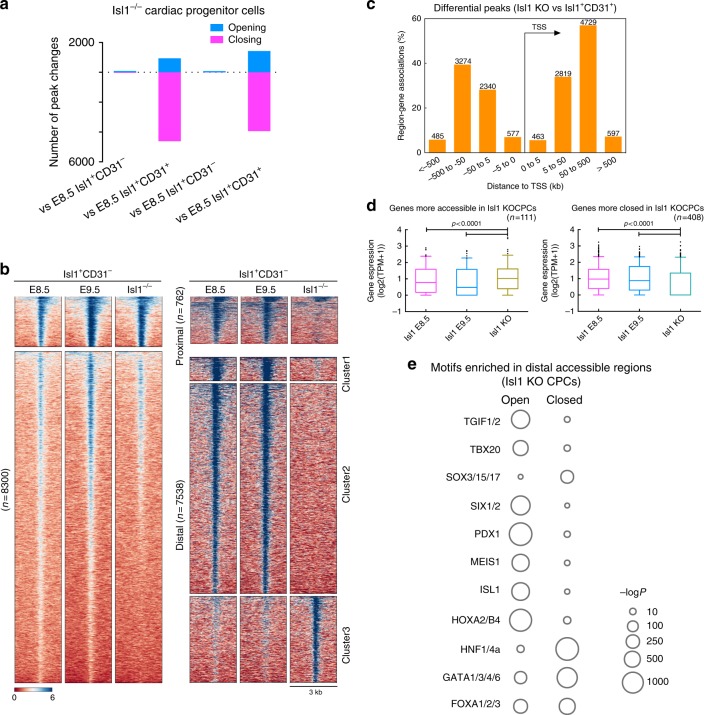
Chromatin accessibility in CPCs is shaped by Isl1. a Number of differential chromatin accessibility peaks (log2(FC) > 2, false discovery rate [FDR] < 0.05). b Genome-wide distribution of differential open chromatin peaks grouped by K-means (left), and by distance to promoter and K-means (right). Each row represents one differential peak, normalized to sequencing depth, in sequential comparisons (log2[FC] > 2, FDR < 0.05). c Number of differential peaks and their distance to the nearest promoters. d Boxplots of mRNA expression levels in E8.5 and 9.5 Isl1+ CPCs, and of genes that are more accessible (left) or more closed (right) in Isl1 KO cells. Box lines show the median, 25th and 75th percentiles; whiskers represent 5th and 95th percentiles; dots represent outlier data points. p-values were calculated using Student’s t-test. n indicates the genes numbers. e Bubble chart showing the enrichment of transcription factor motifs in differential peaks (p-values were calculated from the hypergeometric distribution)

