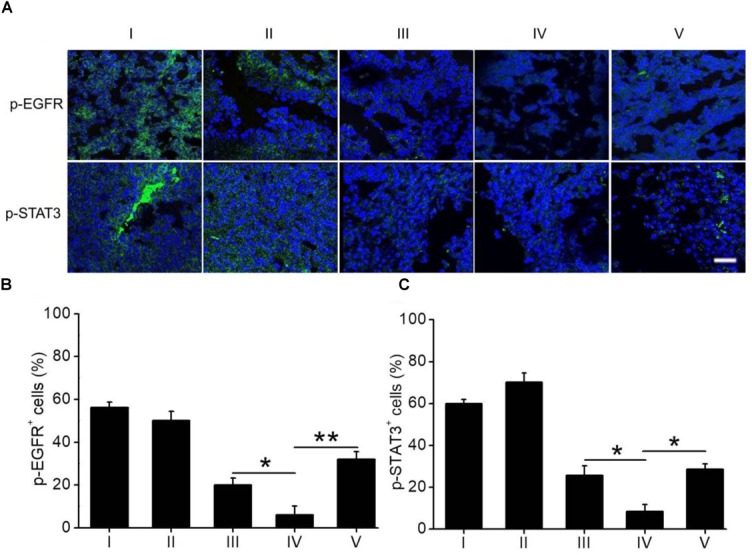
FIGURE 6.

(A) Immunostaining of p-EGFR and p-STAT3 in tumor sections harvested on day 3 post the last injection of different formulations. Bar represents 100 μm. Quantification of the expression levels of p-EGFR (B) and p-STAT3 (C) from the immuno-stained images (n = 20). I: PBS; II: ELTN@PEG-PLA; III: FDTN@PEG-PLA; IV: ELTN+FDTN@PEG-PLA; V: ELTN+FDTN.
