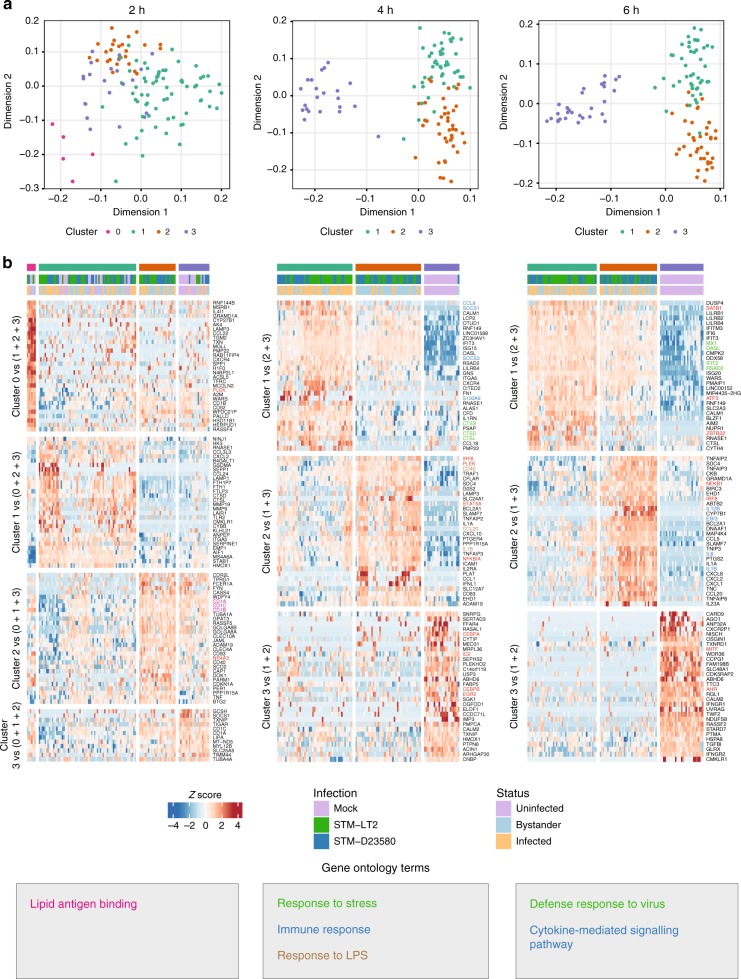
Fig. 2.
Unsupervised clustering reveals variability within infected and bystander cells. a Diffusion maps highlighting the unsupervised clusters identified by rank correlations between gene expression profiles of cells at each time point separately. Diffusion maps were computed on the first 50 components of a principal component analysis (PCA) using the 500 most variable genes identified within cells at each time point separately. b Heat maps displaying up to 30 significant marker genes identified as DE genes (P-value < 0.01) between each unsupervised cluster and all other cells at the corresponding time point (2, 4 and 6 h p.i, respectively). Rows and columns were clustered using Euclidian distance and complete linkage method applied to the row-scaled values across all heat map panels at that time point. Enriched GO categories and associated genes are indicated by colors. Transcription factors are highlighted in red

