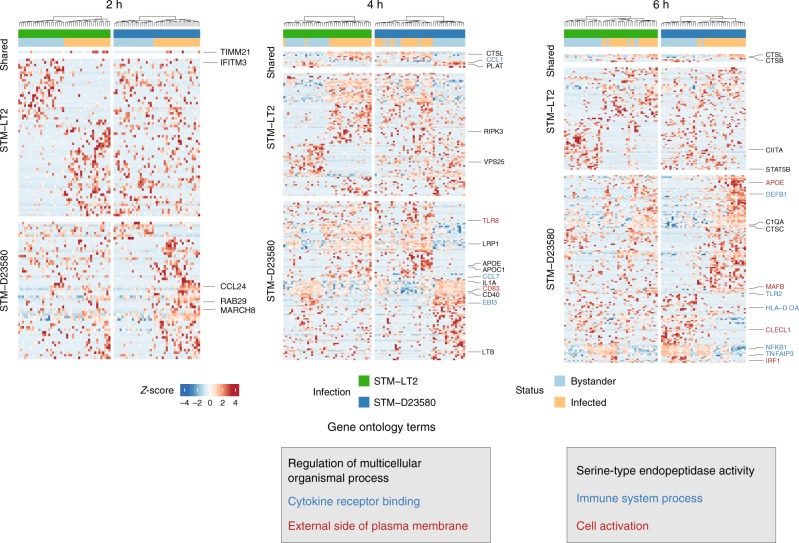
Fig. 3.
STM-D2350 and STM-LT2 induce divergent single-cell profiles in infected and bystander cells. Heat maps displaying significant DE genes (P-value < 0.01) identified between infected and bystander cells at time points 2, 4 and 6 h p.i, respectively. Rows and columns were clustered using Euclidian distance and Ward’s clustering criterion applied to the row-scaled log-transformed normalized counts across all heat map panels at that time point. Enriched GO categories and associated genes are indicated by colors

