Fig. 6.
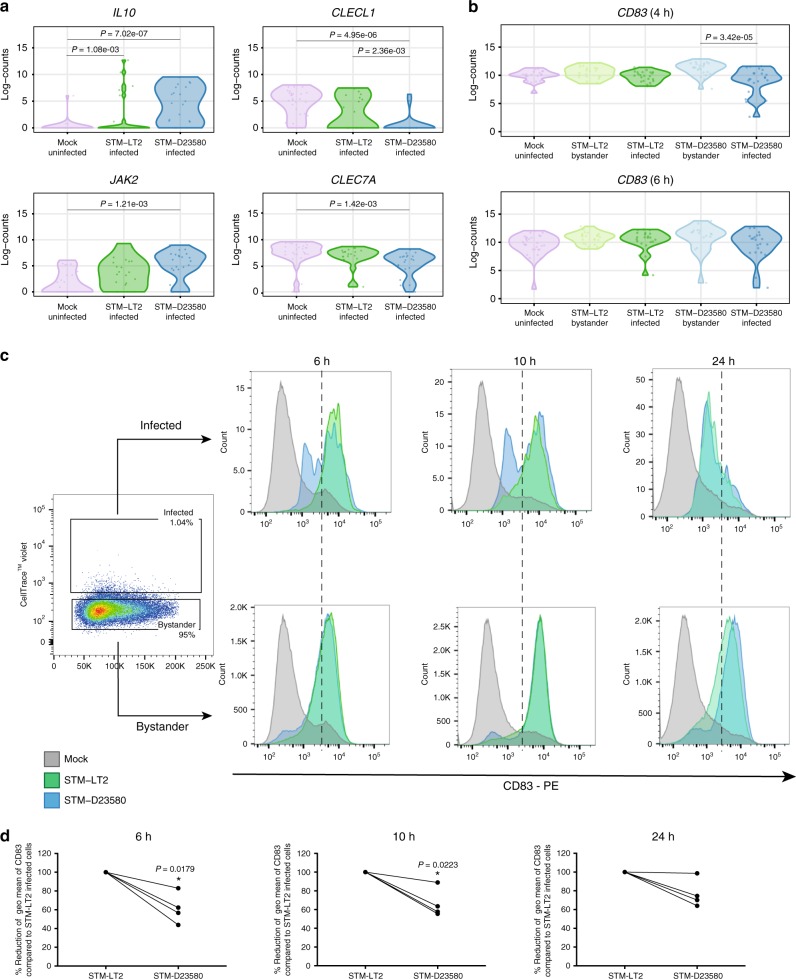
Intracellular STM-D23580 reduces CD83 surface expression. a Violin plots showing single-cell gene expression of IL10, JAK2, CLECL1 and CLEC7A at 6 h p.i. in infected and uninfected cells. b Violin plots showing single-cell gene expression of CD83 at 4 and 6 h p.i. in all experimental groups. c Flow cytometry histograms showing the expression of surface CD83 on gated infected and bystander cells challenged with STM-D23580 (blue), STM-LT2 (green) or left uninfected (grey) for 6, 10 or 24 h. STM-D23580-infected MoDCs display decreased surface expression of CD83 as compared with STM-LT2. Histograms from one representative example of at least four biological replicates. d STM-D23580 infection reduces surface CD83 levels detected by flow cytometry. On the y-axis, the geometric mean of fluorescence levels for CD83 on STM-D23580-infected cells is represented as a percentage of the level in STM-LT2-infected cells, set at 100%. Four independent experiments are shown. Two-tailed paired Student’s t-test, P-value < 0.05 (*)

