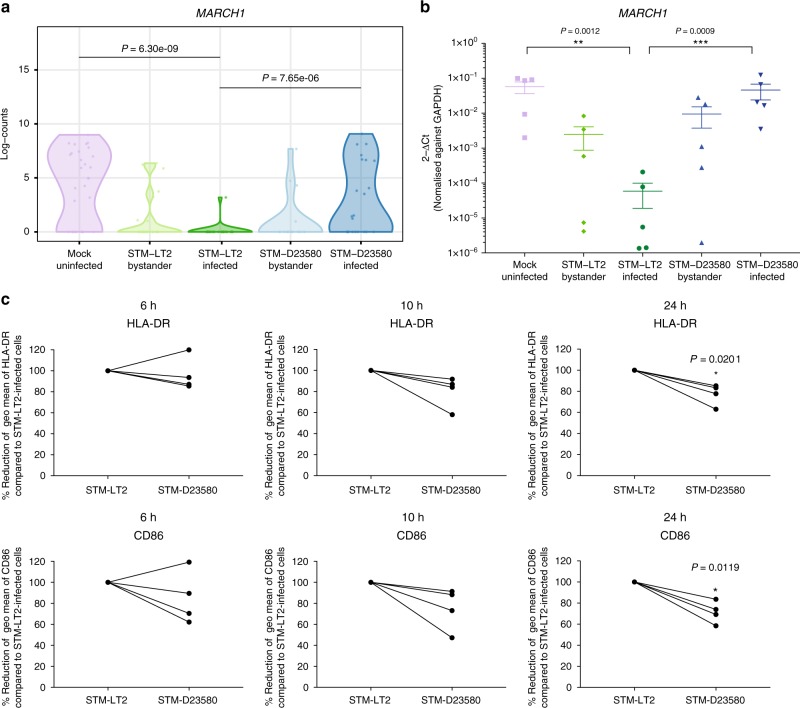
Fig. 7.
Intracellular STM-D23580 reduces HLA-DR and CD86 surface expression compared to STM-LT2. a Violin plot showing single-cell gene expression of MARCH1 at 6 h p.i. in all the experimental groups. b Dot plot showing gene expression of MARCH1 at 6 h p.i detected by qPCR in all experimental groups. The mean±SEM of five independent experiments is shown. Two-way ANOVA test, P-value < 0.01(**), <0.001(***). c Surface HLA-DR and CD86 expression measured by flow cytometry. On the y-axis, the geometric mean of fluorescence levels for HLA-DR and CD86 on STM-D23580-infected cells is represented as a percentage of the level in STM-LT2 infected cells, set at 100%. Four independent experiments are shown. Two-tail paired Student’s t-test, P-value < 0.05 (*)

