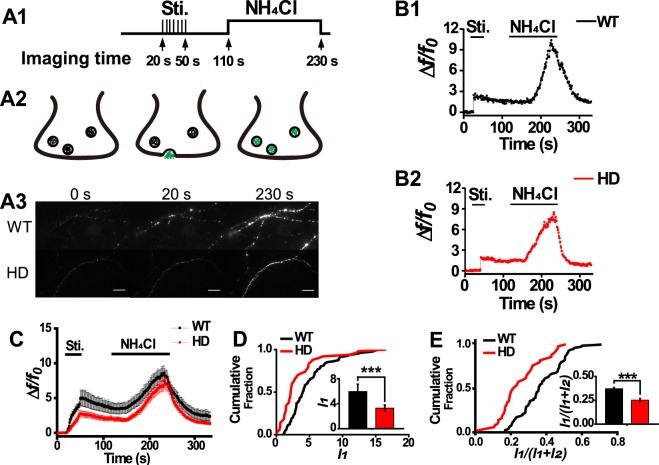
Figure 1.
Release of BDNF-pHluorin in cortical neurons. (A) Schematic diagrams of the experiment paradigm and representative images. (A1) Schematic of the experimental paradigm. The 20 s before stimulation served as the baseline, which was followed by 10-Hz stimulation for 30 s; after a brief rest period, the neurons were perfused with NH4Cl for 120 s, and the bath solution was changed back to normal ACSF after 230 s. Schematic of neuronal response (A2) and representative images (A3) of WT and HD neurons at baseline (0 s), during stimulation (30 s), and during NH4Cl perfusion (230 s). (B) Representative relative fluorescence intensity traces of the BDNF-pHluorin in WT (B1) and HD (B2) cortical neurons. (C) Averaged relative intensity traces of BDNF-pHluorin obtained from WT and HD neurons. (D) Cumulative plot of peak intensity (I1) induced by stimulation. Inset, bar graph of the peak intensity in WT neurons (n = 81 puncta) and HD neurons (n = 50 puncta); the peak intensity in HD neurons was significantly lower compared with WT neurons (***p < 0.001, Mann-Whitney U test). (E) Cumulative plot of peak intensity ratio, calculated as [I1/(I1 + I2)]; I1 and I2 represent the peak intensities induced by stimulation and NH4Cl perfusion, respectively. Inset, bar graph of the peak intensity ratio in WT neurons and HD neurons; the peak intensity ratio in HD neurons was significantly lower compared with WT neurons (***p < 0.001, Mann-Whitney U test). Scale bar: 10 μm.

