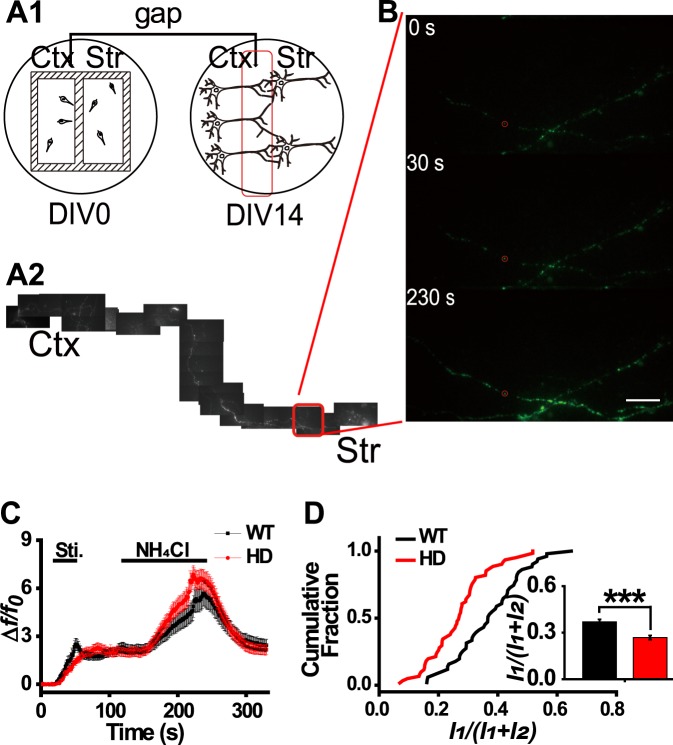
Figure 2.
Release of BDNF-pHluorin from cortical projection neurons close to striatal neurons. (A) Schematic of corticostriatal co-cultures prepared using ibidi 2-well culture inserts and a representative image. (A1) Cortical and striatal neurons were plated in separate compartments and they formed connections after the inserts were removed. A gap area close to the striatal compartment is marked in red. (A2) Representative image showing that a cortical neuron projected to the striatal compartment, in which the imaging area is highlighted by the red box. (B) Response at different times of the cortical projection neuron shown in (A2). (C) Relative fluorescence intensity traces of BDNF-pHluorin at cortical presynaptic terminals close to striatal neurons. (D) Cumulative plot of peak intensity ratio in WT and HD neurons. Inset, bar graph of intensity ratio, showing a significant decrease in HD neurons (n = 61) as compared with that in WT neurons (n = 51); ***p < 0.001, Mann-Whitney U test. Scale bar: 10 μm.

