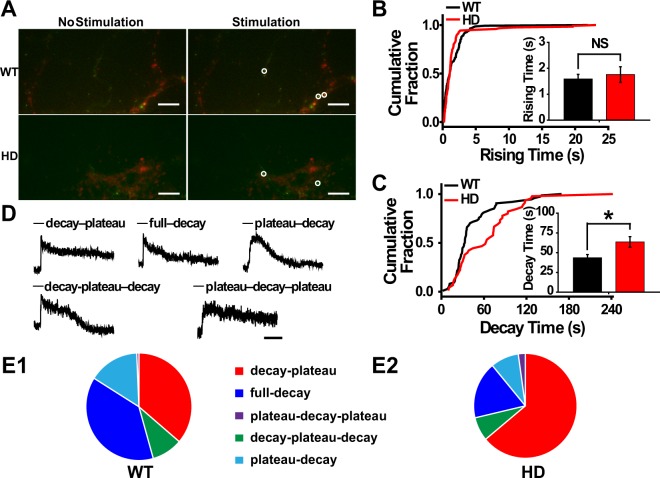
Figure 3.
Release patterns of single BDNF-pHluorin-containing vesicles in cortical projection neurons close to striatal neurons. (A) Representative images of single BDNF-containing vesicles (green) before (left) and after (right) stimulation. Presynaptic terminals are identified by FM4-64 puncta (red). Arrows indicate the release of single BDNF-containing vesicles. (B) Cumulative plot of the rising time constant of fluorescence intensity, which did not differ significantly between WT and HD neurons (Inset, p = 0.8075, Mann-Whitney U test). (C) Cumulative plot of decay time constant, which differed significantly between WT and HD neurons (inset, p = 0.01474, Mann-Whitney U test). (D) Exemplar traces of 5 release patterns. (E) Proportions of distinct release patterns. As compared to WT (n = 149 events, E1), HD neurons (n = 136 events, E2) showed a reduction in the fraction of “full-decay” events but an increase in that of “decay-plateau” events (p < 0.0001, paired χ2 test). NS, not statistically significant, and *p < 0.05, Mann-Whitney U test. Scale bar: 10 μm.

