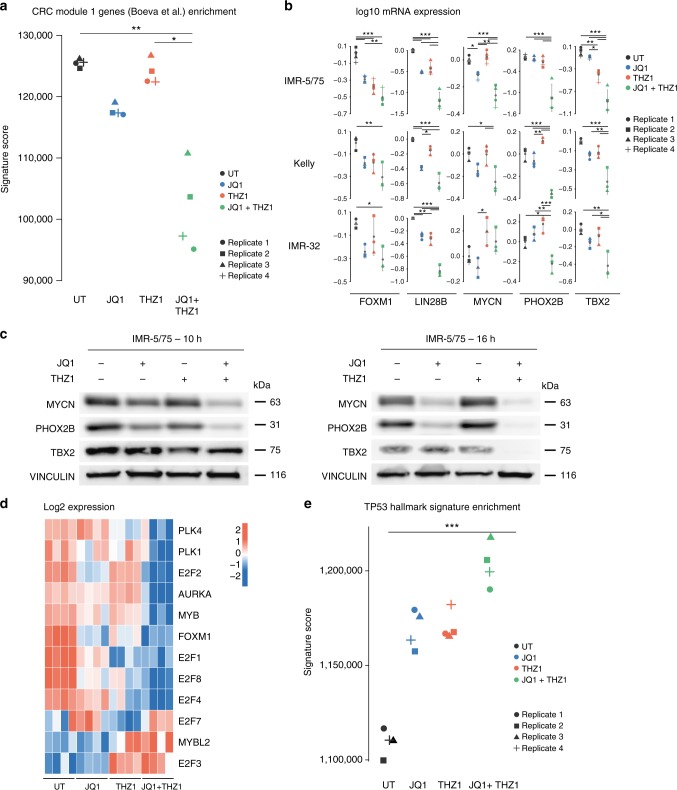
Fig. 8.
Downregulation of the CRC upon combined CDK7-BET inhibition. a Significant downregulation of the Module 1 CRC gene signature15 upon treatment with 1 µM JQ1, 35 nM THZ1 and the combination in the IMR-5/75 cell line for 10 h. Kruskal–Wallis followed by a post-hoc Dunn’s multiple comparisons test (four biological replicates per condition). b log10 TBX2, FOXM1, PHOX2B, MYCN, and LIN28B mRNA levels 10 h upon treatment with 1 µM JQ1, 35 nM THZ1 and the combination of JQ1 and THZ1 in the IMR-5/75, Kelly and IMR-32 cell lines. Error bars represent the s.d. of the three or four biological replicates. ANOVA statistical analysis followed by a post-hoc Tukey’s test for multiple comparisons. c MYCN, PHOX2B, and TBX2 protein levels 10 h and 16 h upon treatment with 1 µM JQ1, 35 nM THZ1 and the combination of JQ1 and THZ1 in the IMR-5/75 cell line. d Heatmap showing the expression levels for the E2F-Dream complex core members upon treatment with 1 µM JQ1, 35 nM THZ1 and the combination of JQ1 and THZ1 in the IMR-5/75 cell line. Kruskal–Wallis followed by a post-hoc Dunn’s multiple comparisons test (four biological replicates per condition). e Significant upregulation of the TP53 Hallmark geneset (MsigDB) upon treatment with JQ1, THZ1 and the combination in the IMR-5/75 cell line for 10 h. Kruskal–Wallis followed by a post-hoc Dunn’s multiple comparisons test (four biological replicates per condition). *p < 0.05, **p < 0.01, ***p < 0.001

