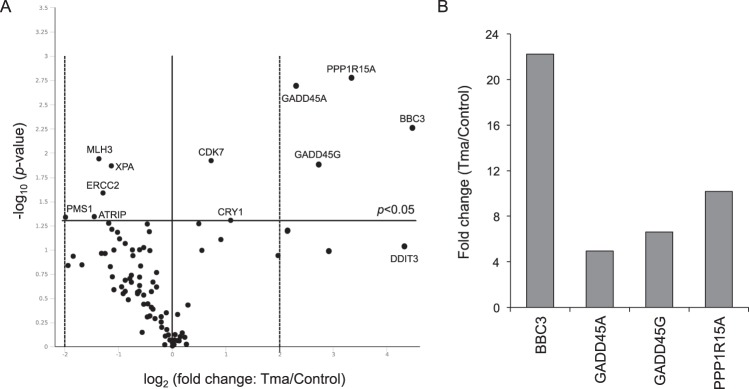
Figure 2.
Gene expression analysis of DNA damage-signalling pathways in tyramine-exposed HT29 cells compared to untreated cells. (A) Volcano plot representation of tyramine-exposed HT29 cultures vs. untreated control cultures. The horizontal black line represents the threshold of statistical significance (p = 0.05). The vertical dotted black lines represent a fold change cut-off of ≥4. (B) Genes showing a statistically significant fold change (≥4) are shown. See also Supplementary Table 2S. Tma: tyramine.

