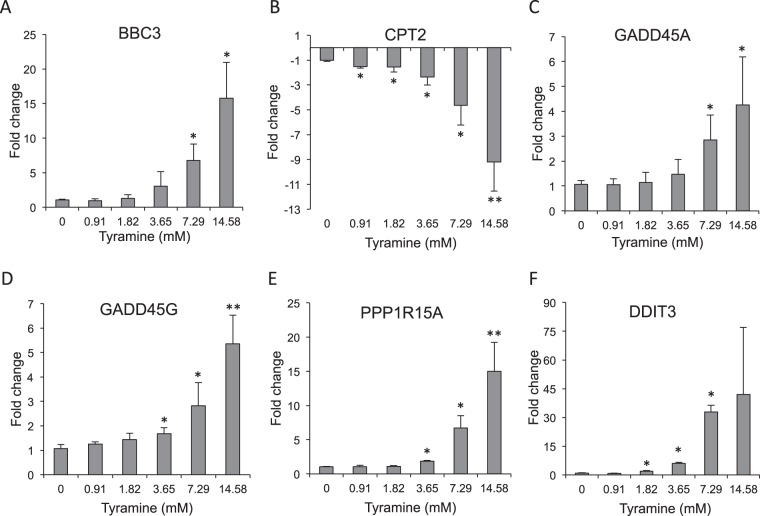
Figure 3.
Real time qPCR gene expression analysis of differently expressed genes – (A) BBC3, (B) CPT2, (C) GADD45A, (D) GADD45G, (E) PPP1R15A and (F) DDIT3 - in tyramine-exposed HT29 cells compared to control cultures. Cell cultures were exposed to one of six tyramine concentrations (0, 0.91, 1.82, 3.65, 7.29 or 14.58 mM) for 6 h. Data were normalized against the total RNA content using GAPDH as a reference gene. The data represent the mean of two biological replicates (each in duplicate). Vertical bars represent standard deviations. *p < 0.05, **p < 0.001 compared to control cultures.

