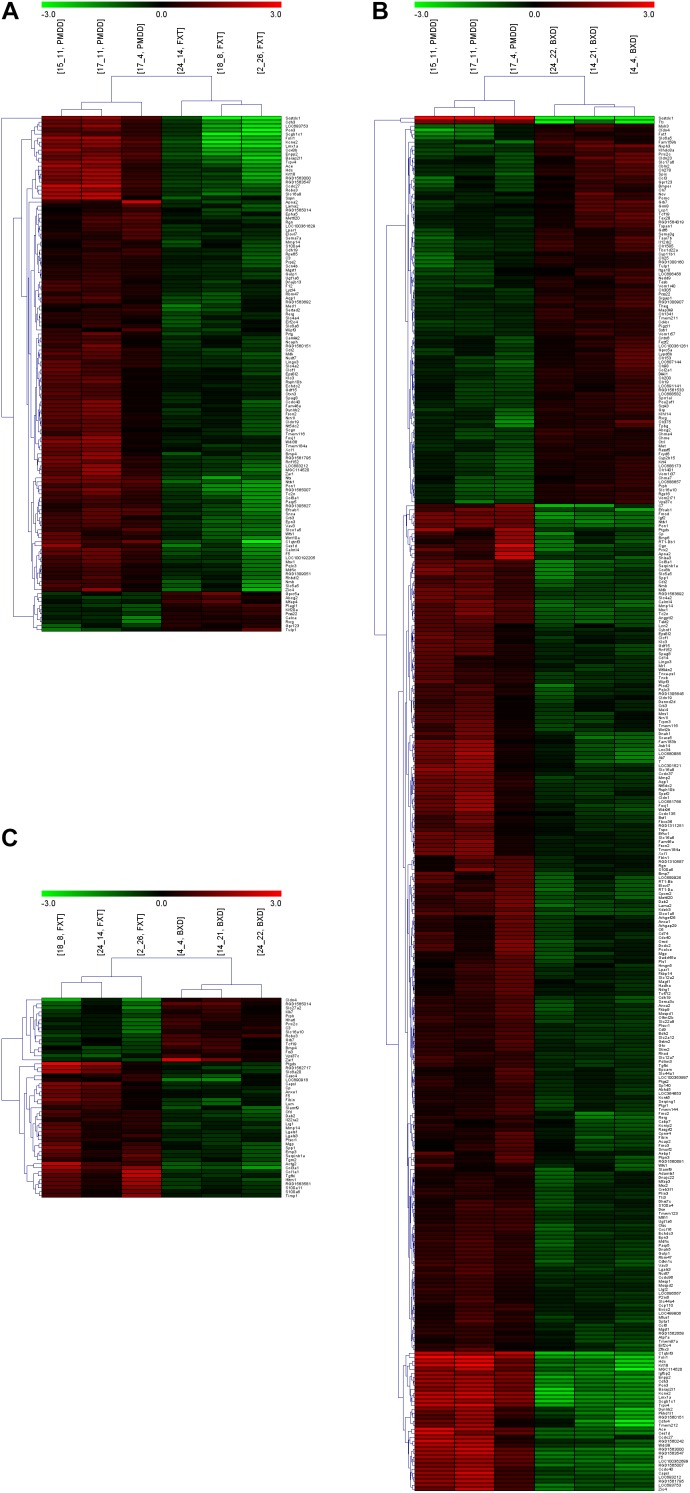
FIGURE 2.
Heat maps and clustering analyses of multiple comparisons. (A) Comparison between the PMDD model group (PMDD, samples including 15_11, 17_11 and 17_4) and fluoxetine administration group (FXT, samples including 24_14, 18_8 and 2_26). (B) Comparison between the PMDD model group (PMDD, samples including 15_11, 17_11 and 17_4) and Baixiangdan administration group (BXD, samples including 24_22, 14_21 and 4_4). (C) Comparison between the fluoxetine administration group (FXT, samples including 24_14, 18_8 and 2_26) and Baixiangdan administration group (BXD, samples including 24_22, 14_21 and 4_4). P < 0.05 and ratio > 2.0.

