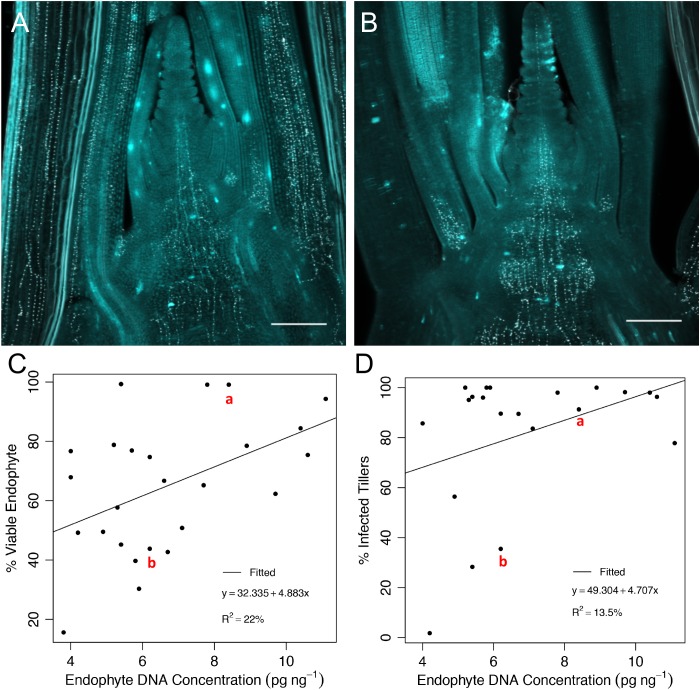
FIGURE 8.
Visualization of endophyte hyphae and hyphal biomass estimates in tiller crown tissues. Confocal microscopy of longitudinal views through the center of tillers showing hyphae in tiller tissues of a representative (A) high-transmitting parental genotype, 107 and (B) low-transmission genotype, 13 of Population IV. The white dots are labeled septa separating adjacent hyphal compartments (WGA-488, false color white), and scale bar represents 0.2 mm. Scatterplots of the % viable endophyte transmission rates (based on seed harvested at the Grasslands Research Centre in 2013) (C) and % tiller infection rates taken in 2016 (D), relative to endophyte DNA concentration in the shoot apex tissues for a subset of 24 parent plant genotypes from Population IV. Data points for the genotypes shown in panels (A,B) are labeled in red.

