Fig. 5.
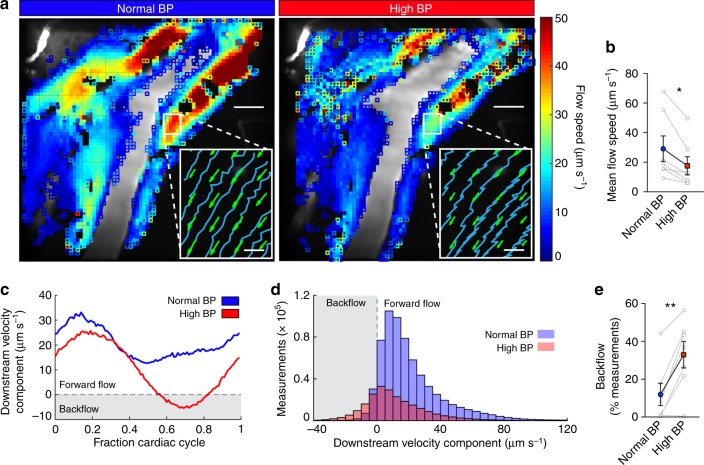
Acute arterial hypertension reduces net CSF flow in the perivascular space by increasing backflow. a Local time-averaged flow speeds for the normal and high blood pressure time intervals. Closed squares indicate regions with at least 20 measurements, open squares fewer than 20. The flow speed is substantially reduced in hypertension. Scale bars: 40 µm. (Insets) Sample microsphere trajectories (blue curves) and mean flow velocities (green arrows) in the region indicated by the white box. Microsphere trajectories show increased backflow in hypertension. Scale bars: 5 µm. b Measurements of the mean flow speed for normal and high blood pressure. Paired t-test, *P = 0.0119, mean ± SEM, n = 7. c The average downstream velocity component plotted as a function of the fraction of the cardiac cycle, averaged over all velocity measurements obtained in a small region, for normal and high blood pressure (measurements correspond to the mouse shown in a). Hypertension is characterized by backflow over a short segment of the cardiac cycle. d Histograms of the downstream velocity component computed for intervals of normal and high blood pressure for the mouse shown in a. We obtain fewer high blood pressure measurements (2.3 × 10⁵, compared to 6.6 × 10⁵ for normal blood pressure) because slower flow brings fewer particles into the field of view. The distribution shifts left indicating an increase in backflow when blood pressure is high. e The percent of total measurements which correspond to backflow (i.e., negative measurements of the downstream velocity component) calculated for normal and high blood pressure. Paired t-test, **P = 0.0035, mean ± SEM, n = 7. In hypertension, slower net flow and increased backflow are consistent with an alteration of the perivascular pump, characterized by the changes to the arterial waveform and wall velocity

