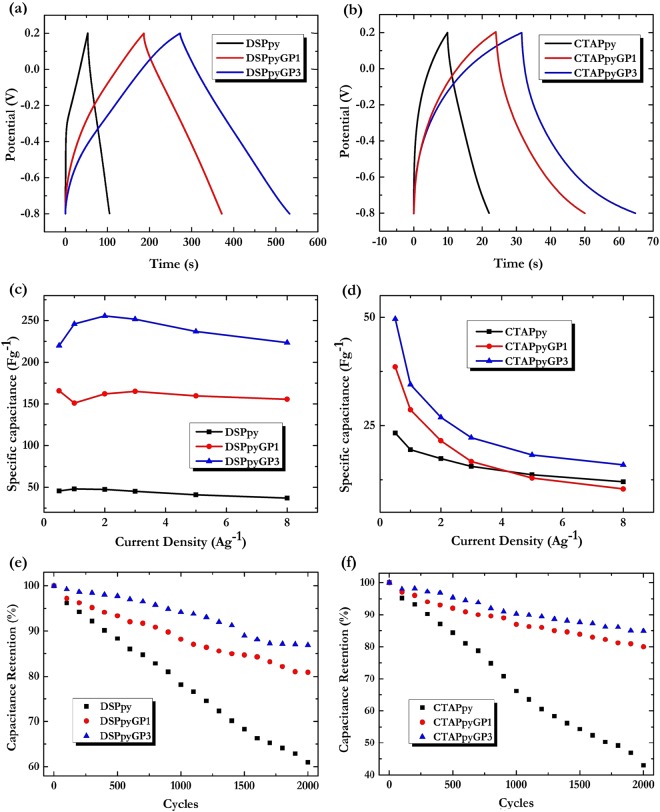
Figure 12.
Panel above: GCD curves in 0.1 M TBAP in CH3CN at current density of 1 A g−1 of: (a) DSPpy (black), DSPpyGP1 (red), DSPpyGP3 (blue); (b) CTAPpy (black), CTAPpyGP1 (red), CTAPpyGP3 (blue). Panel central: Specific capacitance of: (c) DSPpy (black), DSPpyGP1 (red), DSPpyGP3 (blue); (d) CTAPpy (black), CTAPpyGP1 (red), CTAPpyGP3 (blue) at different current densities. Panel below: Percentage retention of the specific capacitance as a function of the charge-discharge cycles of: (e) DSPpy (black), DSPpyGP1 (red), DSPpyGP3 (blue) at current density of 2 A g−1; (f) CTAPpy (black), CTAPpyGP1 (red), CTAPpyGP3 (blue) at current density of 0.5 A g−1.

