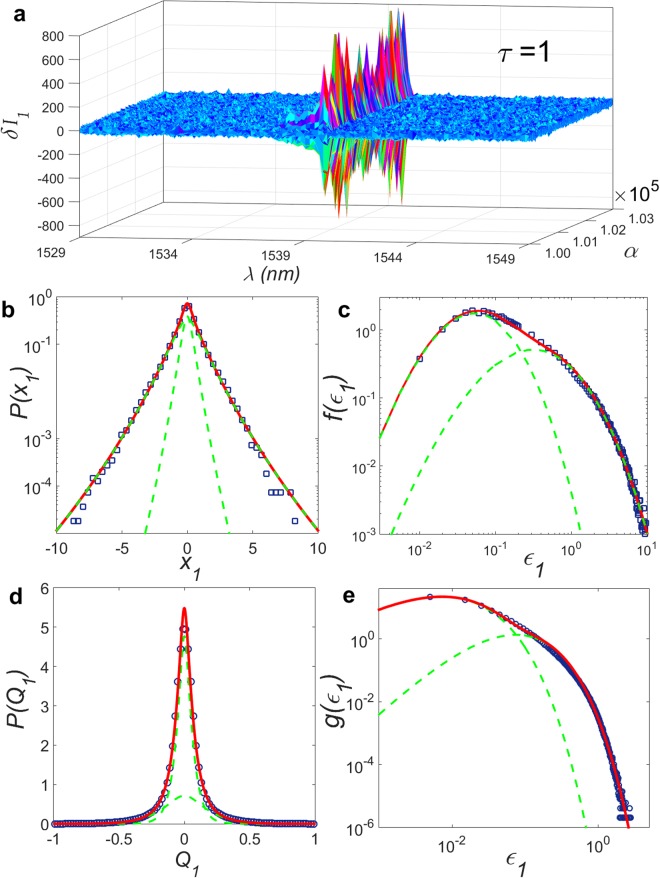
Figure 2.
Photonic turbulence and intermittency effect for short separation time scale between RFL spectra (τ = 1). (a) Plot of 3000 experimental intensity increments, δIατ(k) = Iα + τ(k) − Iα(k), between successive spectra (τ = 1) as a function of the spectrum label α and wavelength λ indexed by k in the interval [1529.0 nm, 1549.0 nm]. (b) Distribution P(xτ), τ = 1, of normalized increments , at the wavelength λ = 1539.8 nm around the peak emission, obtained from the whole set of 150,000 spectra (blue squares). The large deviation from the parabolic shape observed in this semi-log plot is consistent with the non-Gaussian photonic turbulent-like behaviour of P(x1), which arises for this maximum intermittency state at τ = 1. The red solid line displays the nice fit to the results of the hierarchical model, with P(x1) given by a statistical mixture of two Meijer-G functions with N = 6 intensity fluctuation time scales. (c) Associated variance distribution f(ε1) from which P(x1) is obtained via the superposition integral (2). Experimental data (blue squares) are also nicely fitted by the theoretical result (red solid line). The individual mixture components are shown by green dashed lines in (b) and (c). (d) Distribution P(Q1) of values of the photonic Pearson coefficient and (e) associated variance distribution g(ε1) calculated from 10,001 spectra. The model results for NQ = 2 (red solid lines) also adjust remarkably well to the experimental data (blue circles), with the mixture components shown in green dashed lines.

