Fig. 3.
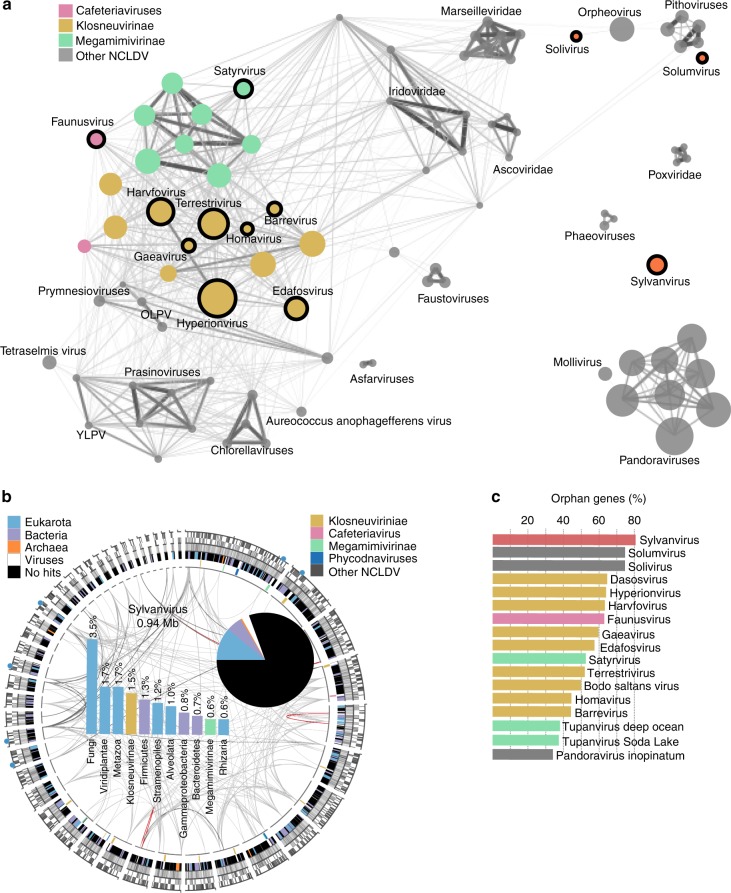
Genome novelty of soil giant viruses. a Nucleocytoplasmic large DNA virus (NCLDV) gene sharing network, with nodes representing genomes, node diameter correlating with genome size, edge diameter and color intensity with normalized percentage of genes in shared gene families between node pairs above a threshold of 18%. b Circular representation of the sylvanvirus genome. From outside to inside: Blue filled circles depict location of encoded tRNAs. The second ring displays positions of genes (gray) either on the minus or the plus strand. The next track illustrates GC content in shades of gray ranging from 20% (white) to 60% (dark gray). The fourth track shows color-coded origin of proteins with best blastp hits (e-value 1e−5) to cellular homologs. Best hits against viral proteins are indicated in white and if possible, further broken down based on their taxonomic origin color-coded on the most inner track. Finally, lines in the middle of the plot connect paralogs (gray) and nearly identical repeats (orange). The pi chart in the center of the plot summarizes the percentage of genes with and without cellular homologs, which are further broken down based on best blastp hits (e-value 1e−5) hits in the adjacent bar plot. c Percentage of genes in NCLDV genomes with bacterial or eukaryotic homologs and with no blastp hits (e-value 1e−5) in the NCBI nr database, highlighting the unique position of sylvanvirus

