Fig. 6.
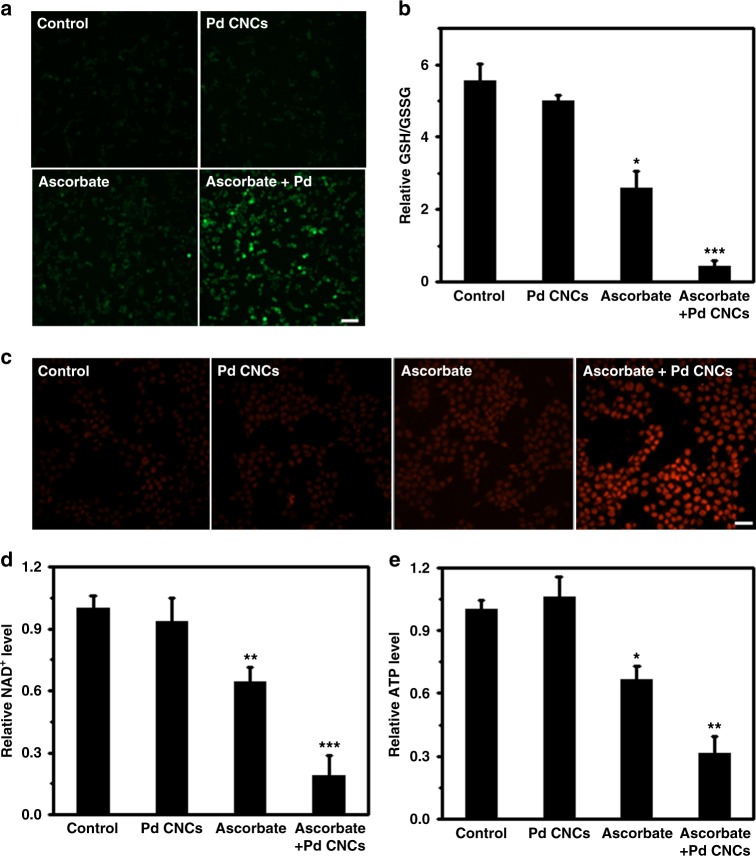
Mechanisms of ascorbate-induced cytotoxicity enhanced by Pd CNCs. a Representative fluorescence images of intracellular ROS levels stained with DCFH-DA probes. HCT116 cells were respectively treated with 2 mM ascorbate, 50 μg/mL Pd CNCs, or combined ascorbate/Pd CNCs. Scale bar: 70 μm. b Relative ratios of reduced to oxidized glutathione (GSH/GSSG) in HCT116 cells after various treatments. c Representative fluorescence images of fragmented DNA in HCT116 cells after various treatments using the TUNEL assay. Scale bar: 35 μm. d Changes in NAD+ levels. e ATP levels in HCT116 cells after various treatments. Error bars were taken from three parallel experiments (n = 3). P values compared to that of corresponding PBS-treated cells were calculated by Student´s t-test: *p < 0.05, **p < 0.01 and ***p < 0.001 vs control

