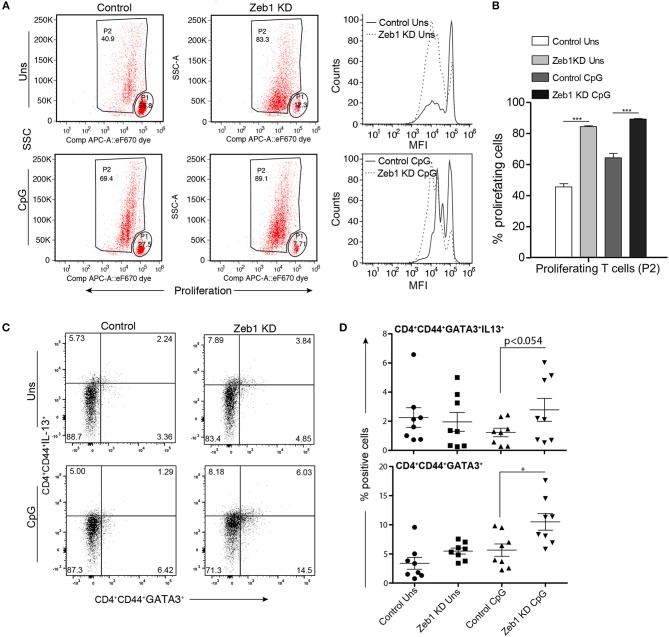
Figure 4.
OT-II T helper cells co-cultured with CpG activated Zeb1 KD cDC1 MutuDCs showed enhanced proliferation and differentiation toward Th2 phenotype. (A) Representative FACS dot-plots showing gated parent population (P1) and proliferating cell population (P2) depicting the changes in proliferation rate of OT-II Th cells co-cultured for 72 h with Zeb1 KD cDC1 MutuDCs as compared to control DCs with or without CpG pulsing. The corresponding panel shows the histogram showing the MFI shifts for the proliferation of T cells. n = 3. (B) Bar-plot depicting the percentage of proliferating Th cells (P2) in CD4+ T cells co-cultured with unstimulated and CpG activated Zeb1 KD and control DCs n = 3. (C) FACS dot-plots showing the percentage positive CD4+CD44+GATA3+IL-13+ Th cells in Th cells co-cultured with unstimulated and CpG pulsed Zeb1 KD and control cDC1 MutuDCs for 96 h n = 8. (D) Scatter-plots showing the percentage of double positive cells for GATA3+IL-13+ and single positive GATA3+ cells in effector CD4+CD44+ Th cell population n = 8. p-values are calculated using two tailed unpaired student's t-test, error bars represent SEM. * ≤ 0.05, *** ≤ 0.001.

