Fig. 5.
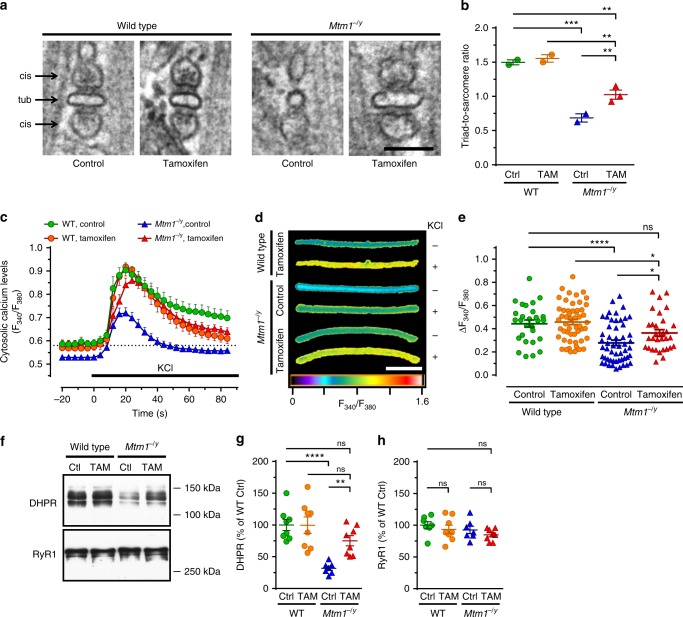
Tamoxifen improves triad density and excitation-contraction coupling, Triads and excitation–contraction coupling were examined in 42 days old (D42) mice either untreated (control; Ctrl) or treated with tamoxifen (TAM; 30 mg kg−1 in diet). a Triads—specialized membrane structures made of a t-tubule (tub) flanked by terminal cisternae (cis) arising from the sarcoplasmic reticulum and controlling Ca2+ release—were visualized by transmission electron microscopy (TEM) in the tibialis anterior (TA) of mice at D42. Note the abnormal shape of the remaining triads in the Mtm1−/y mouse and recovery with tamoxifen treatment. The bar represents 100 nm. b The number of well-positioned triads per sarcomere unit was determined from TEM pictures in TA from wild type (WT) and Mtm1−/y mice at D42. TAM partly rescued the much decreased triad density in Mtm1−/y mice. Mean ± s.e.m. of n = 2–3 mice. c–e Excitation–contraction coupling assessed via live imaging of Ca2+ fluxes induced by KCl depolarization in single FDB myofibers (see Online Methods for details). c Average traces of the responses of FDB fibers to KCl, an experimental setting that mimics muscle depolarization (n = 17–29 fibers). d Representative images (pseudo-colored) illustrating cytosolic Ca2+ levels in FDB fibers at baseline (−; before KCl pulse) and at the peak of KCl-induced response (+). The bar represents 100 μm. e Quantification of cytosolic Ca2+ at the peak response. TAM enhanced Mtm1−/y cytosolic Ca2+ to levels found in WT. Data shown in e represent, from left to right, the mean ± s.e.m. of n = 29, 53, 53, and 31 fibers. f Representative western blots of DHPR and RyR1. g, h Quantification of DHPR and RyR1, respectively. Mean ± s.e.m. of n = 7 muscles. *P ≤ 0.05; **P ≤ 0.01; ***P ≤ 0.001; ****P ≤ 0.0001; ns non-significant. One-way ANOVA followed by Fisher’s LSD post-test

