Fig. 6.
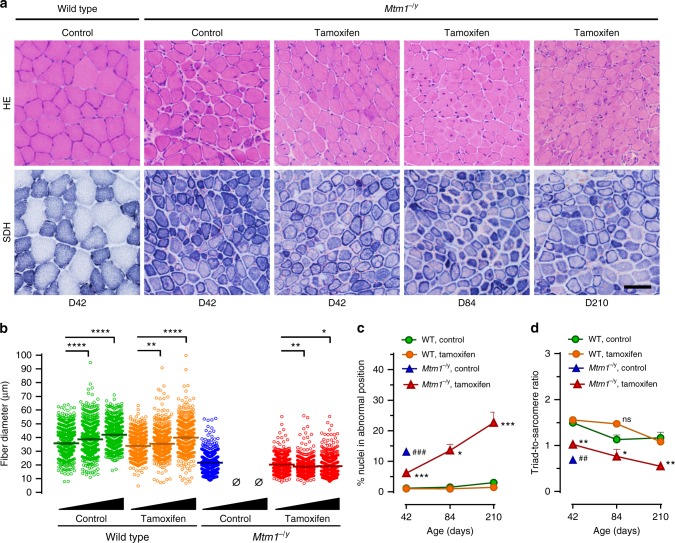
Myopathic features after long-term tamoxifen treatment, Muscle structure and triads were examined by histology and transmission electron microscopy, respectively, in wild type (WT) and Mtm1−/y mice during long-term treatment with tamoxifen (30 mg kg−1 in diet). a Representative pictures of tibialis anterior (TA) sections from untreated WT and Mtm1−/y mice at D42, and tamoxifen-treated Mtm1−/y mice at D42, D84, and D210 stained with hematoxylin–eosin (HE) or for succinate dehydrogenase (SDH) activity. Muscle structure of Mtm1−/y mice was stable over the duration of tamoxifen treatment. The bar represents 50 µm. b Scatter plots showing the distribution of TA myofiber diameter in mice at D42, D84, and D210 (black triangles illustrate increasing age). Fiber size remained almost constant from D42 to D210. N = 600 myofibers per group. c The percentage of abnormally positioned nuclei (either internally or centrally located) in TA myofibres of mice at D42, D84, and D210 were counted from hematoxylin–eosin-stained sections. The density of abnormally positioned nuclei increased significantly with ageing. Mean ± s.e.m. of n = 2–5 TA per group. d The number of well-positioned triads relative to sarcomere number, determined from TEM pictures in TA from wild type and Mtm1−/y mice, showed no significant change from D42 to D84. Black triangles illustrate increasing age (42–84 and 210 days). Mean ± s.e.m. of n = 2–3 TA per group. *P ≤ 0.05; **P ≤ 0.01; ***P ≤ 0.001; ****P ≤ 0.0001. ##P ≤ 0.01; Mtm1−/y control vs tamoxifen at D42. ns non-significant; Ø no surviving mice. One-way ANOVA followed by Fisher’s LSD post-test

