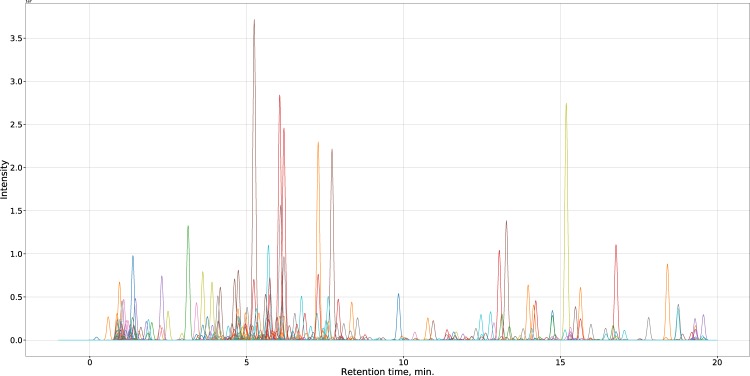
Figure 1.
Synthetic chromatrogram reconstructed from one of the sample vectors for Anethum graveolens in the dataset. Values from all 1600 variables (m/z values 100–900, negative and positive polarities) were simulated as Gaussian peaks. Area of each individual peak is directly proportional to magnitude of corresponding value in data vector. Retention times were retrieved from the original LC-MS data. Peak colors were chosen randomly.

