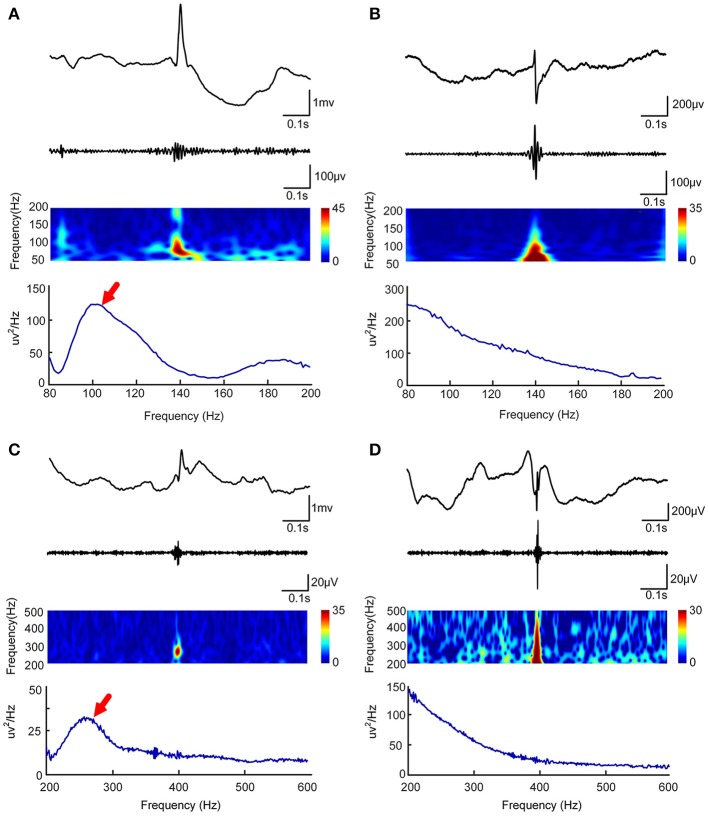
Figure 1.
Visual and automated identification of false HFOs. In (A–D), the first rows show one second of iEEG raw data, the second rows show the iEEG signal after the band-pass filtering [80–200 Hz for (A,C) and 200–500 Hz for (B,D)], the third rows show the Morlet wavelet spectrum, while the last rows represent a power spectral density map (PSD). The real HFOs appear as isolated islands (A,C) while false HFOs appear as a mountain-like shape (B,D) in the time-spectrum. On the power spectral density map, true HFOs have obvious peaks in the corresponding frequency range (arrows, A,C), but these peaks do not appear in the false HFOs (B,D).

