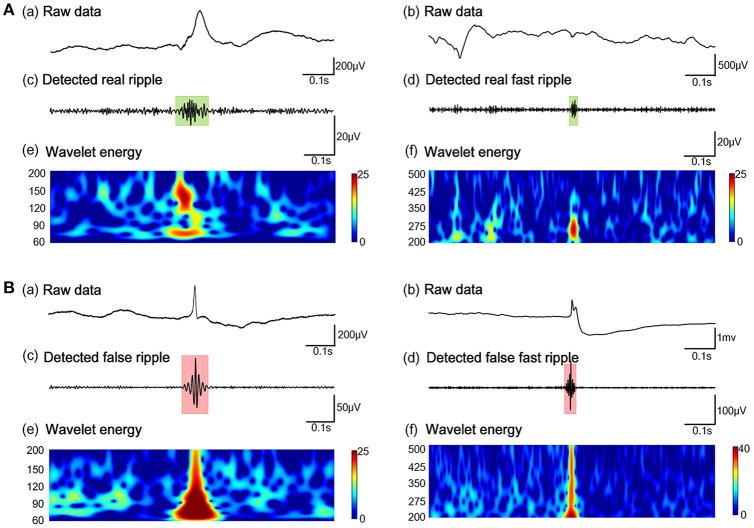
Figure 3.
Example of the automated identification of true and false HFOs using our algorithm. (A) Real ripples and FRs. (B) Present false ripples and FRs. Panels (Aa, Ab, Ba, Bb) show one-second of raw iEEG signals. Panels (Ac, Ad) shows true HFOs were detected by our automated detector. Panels (Bc, Bd) show false HFOs which were identified by our automated detector. Panels (Ae, Af, Be, Bf) show the Morlet wavelet spectrum. The green regions and red regions represent the time points of HFOs.

