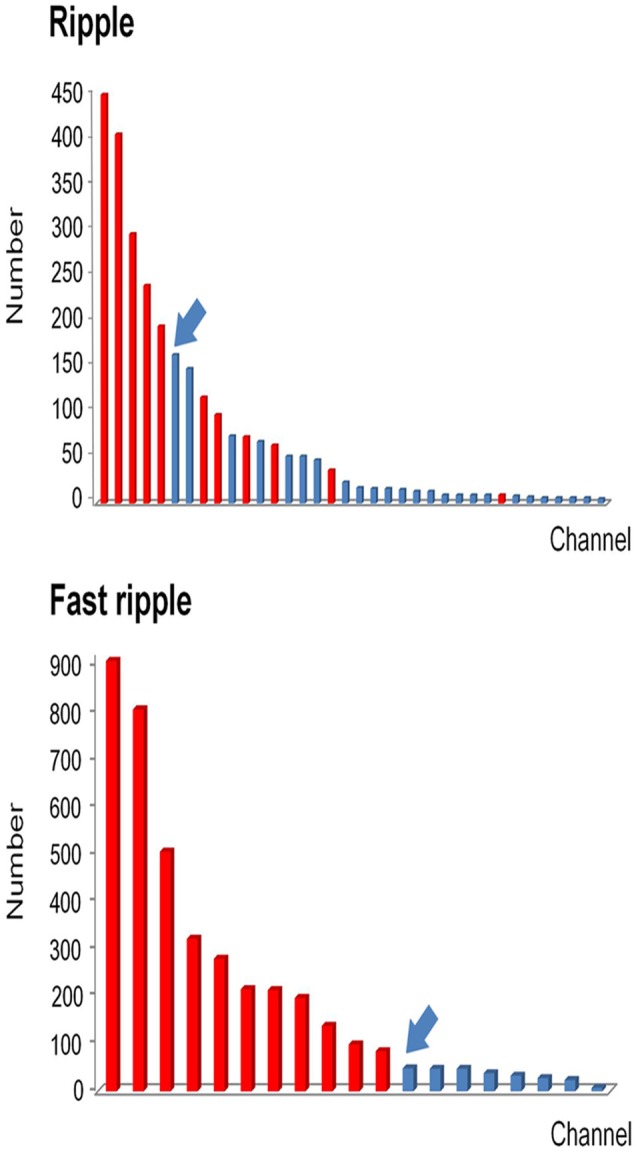
Figure 4.

Example of how channels can be ranked in a descending order according to HFO rates. All channels which detected HFOs were ranked in a descending order according to HFO rates. Channels that were removed during the operation are marked in red, while non-removed channels are marked in blue. Then we identified the first channel that was not continuously removed from the highest ranking (arrows). Based on this channel, we then calculated the continuous resection ratio of high HFO order channels.
